| Global Market | Oil & Gas Rev | Clean Energy Investment | Brent (Spot) | Renewable Share | M&A EV/EBITDA | XLE YTD |
|---|---|---|---|---|---|---|
| $8T+ | $6.9T | $2.2T | ~$109/bbl | 34.3% | 6.9x | +26.4% |
Table of Contents
- Executive Summary
- Market Overview & Sizing
- Global Energy Investment & Capital Flows
- Industry Structure & Value Chain
- Key Trends & Drivers
- Energy Transition: EVs, Batteries, Hydrogen & CCUS
- Competitive Landscape
- M&A Activity & Deal Flow
- Valuation Context
- Geopolitical Risk Assessment
- Investment Implications
- 10.1 Best Risk/Reward Opportunities
- 10.2 Key Sector Debates
- 10.3 Catalysts to Watch
- Appendix: Sources & Methodology
Executive Summary
The global energy sector is at a pivotal crossroads in April 2026, shaped by the convergence of the most severe geopolitical supply disruption since the 1973 oil embargo, the structural acceleration of the energy transition, and unprecedented AI-driven power demand growth. The total global energy market exceeds $8 trillion in annual revenue, spanning traditional oil and gas (~$6.9T), renewables, utilities, nuclear, and energy infrastructure.
The Strait of Hormuz crisis dominates the near-term outlook. Following the launch of Operation Epic Fury on February 28, 2026, Iran’s IRGC declared the Strait “closed” on March 2, removing approximately 20% of global oil supply from the market. Brent crude surged from a pre-war ~$65-71/bbl to a peak of ~$126/bbl on March 8, and currently trades at approximately $109/bbl. WTI has structurally inverted above Brent at ~$112/bbl, reflecting US trader pricing of Iran conflict duration risk. The IEA authorized its largest-ever coordinated strategic reserve release of 400 million barrels. Shipping through the Strait has collapsed 90-95% from pre-crisis levels, with 23 confirmed attacks on merchant vessels through March 31.
Clean energy investment has overtaken fossil fuels for the first time. The IEA’s World Energy Investment 2025 report documents a record $3.3 trillion in total global energy investment, with clean energy technologies accounting for $2.2 trillion, now double the $1.1 trillion flowing into fossil fuel supply. Solar PV alone attracted $450 billion. Renewables surpassed coal for the first time in global electricity generation in H1 2025, now supplying 34.3% of the world’s electricity. Global renewable capacity additions reached a record 520-692 GW in 2025, with total installed capacity reaching ~5,150 GW, representing 49.4% of global installed electricity capacity.
AI-driven power demand is reshaping grid planning and energy investment. US data centers consumed 176 TWh in 2023 (4.4% of US electricity) and are projected to exceed 400 TWh by 2030. The top five hyperscalers have announced $710 billion in combined 2026 capex. Nuclear power procurement has become the hyperscalers’ strategy of choice: Microsoft/Constellation (835 MW Three Mile Island restart), Amazon/Talen (1,920 MW Susquehanna), Meta (~7.7 GW across multiple deals), and Google/Kairos Power (500 MW SMRs).
M&A activity has been transformative. Global energy M&A rose 27-31% in 2025, with deal values reaching $334 billion and 20 megadeals exceeding $5 billion. The Devon Energy-Coterra $58 billion merger (announced February 2026) creates the largest Delaware Basin operator. Constellation Energy’s $26.6 billion acquisition of Calpine creates the largest US power producer at ~55 GW. Upstream E&P deal multiples expanded from ~4x EV/EBITDA in 2022 to ~6.9x in 2025.
The energy sector trades at a persistent valuation discount to the broader market, with a trailing P/E of approximately 16.6x versus the S&P 500 at ~21x. Despite this, the XLE has posted a +26.4% return YTD in 2026, making energy the only positive S&P 500 sector against the index’s -7.3% decline. The collision of geopolitical supply shock, accelerating electrification, and AI-driven power demand creates an extraordinarily complex investment landscape where the best-positioned companies span both traditional and clean energy with scale, strong balance sheets, and exposure to structural power demand growth.
1. Market Overview & Sizing
1.1 Total Addressable Market
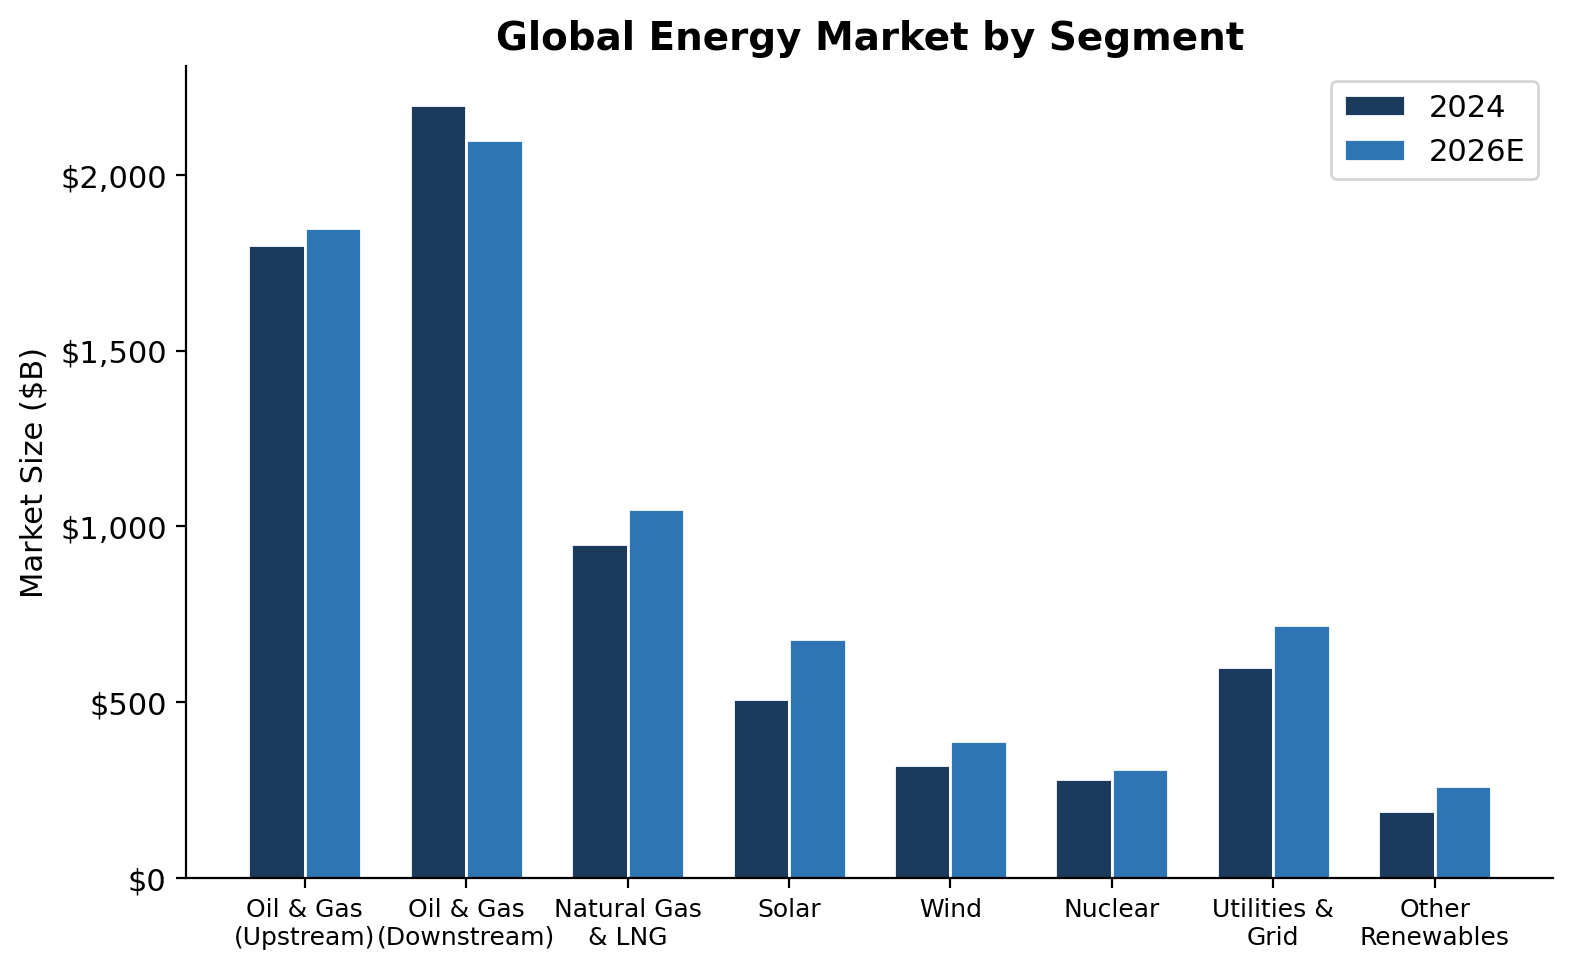
The global energy market is vast and multifaceted. The oil and gas segment alone is valued at approximately $6.9 trillion, with the broader energy market (including renewables, nuclear, and utilities) exceeding $8 trillion when accounting for all downstream activities and energy services. Growth trajectories differ markedly by subsegment: traditional hydrocarbons are growing at a modest 2-3% CAGR, while renewables are expanding at 14-15% CAGR through 2030. The energy storage market has emerged as the fastest-growing segment, with annual installations surpassing 100 GW for the first time in 2025.
| Segment | Market Size | Growth | Key Driver | Primary Risk |
|---|---|---|---|---|
| Oil & Gas | ~$6.9T | 2-3% CAGR | Global transport & industrial demand | Hormuz crisis; oversupply; transition |
| Renewables | ~$650B+ | 14-15% CAGR | Cost declines; policy support | China policy shift; IRA rollbacks; grid constraints |
| LNG & Gas Infrastructure | ~$400B+ | 8-10% CAGR | Asia/Europe demand; LNG globalization | Qatar force majeure; permitting delays |
| Energy Storage | ~$66B investment (2025) | 20%+ CAGR | Grid integration; EV adoption; AI demand | Supply chain; tariffs on Chinese cells |
| Nuclear | ~$70B+ investment (2025) | 5-8% CAGR | AI data center PPAs; energy security | Regulatory timelines; cost overruns; SMR commercialization |
| Grid Infrastructure | ~$470B investment (2025) | 10-16% CAGR | Electrification; renewable integration | Transformer shortages; permitting backlogs |
| Total Energy Market | $8T+ | ~4% blended | Electrification; AI power demand | Geopolitics; commodity cycles; policy |
1.2 Market Segmentation
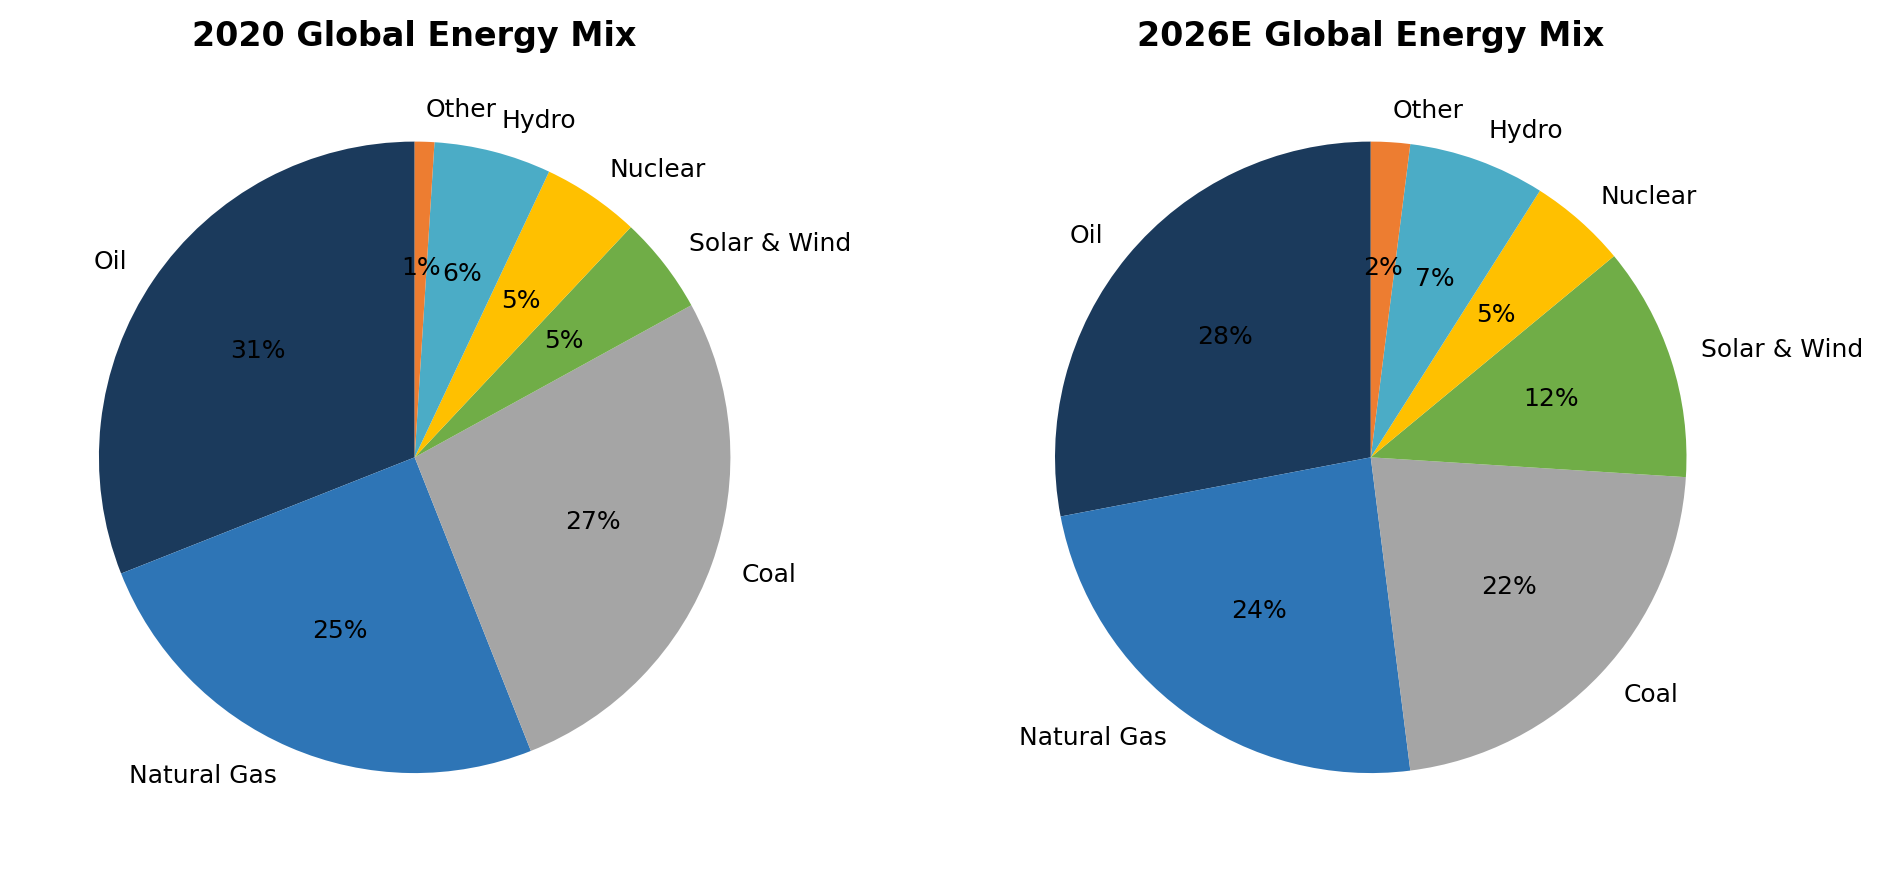
The energy market can be segmented across several dimensions. By source, oil remains the single largest energy source globally at approximately 28% of the primary energy mix in 2026, followed by natural gas at 24% and coal at 22%. Solar and wind have grown rapidly to reach a combined 12% of the global energy mix, up from just 5% in 2020. Nuclear provides approximately 10% of global electricity, with capacity expected to grow 33-70% by 2035 (IEA). By geography, Asia Pacific is the fastest-growing demand center (led by China and India), while North America remains the largest single producer of oil and natural gas. By end use, transportation still accounts for the majority of oil demand, while power generation is the most dynamic segment due to the ongoing displacement of coal by gas and renewables, and the accelerating demand from data centers.
The IEA’s World Energy Outlook 2025 projects global oil demand peaking before 2030 in all scenarios, but the timing and magnitude of the decline varies dramatically. Under the Stated Policies Scenario (STEPS), demand plateaus at ~106 mb/d around 2028-2030 before gradually declining. Under the Net Zero Emissions scenario, demand falls below 55 mb/d by 2050. Natural gas demand growth is more resilient, underpinned by LNG trade expansion and power generation needs, particularly for AI infrastructure.
1.3 Oil Price Dynamics & the Hormuz Crisis
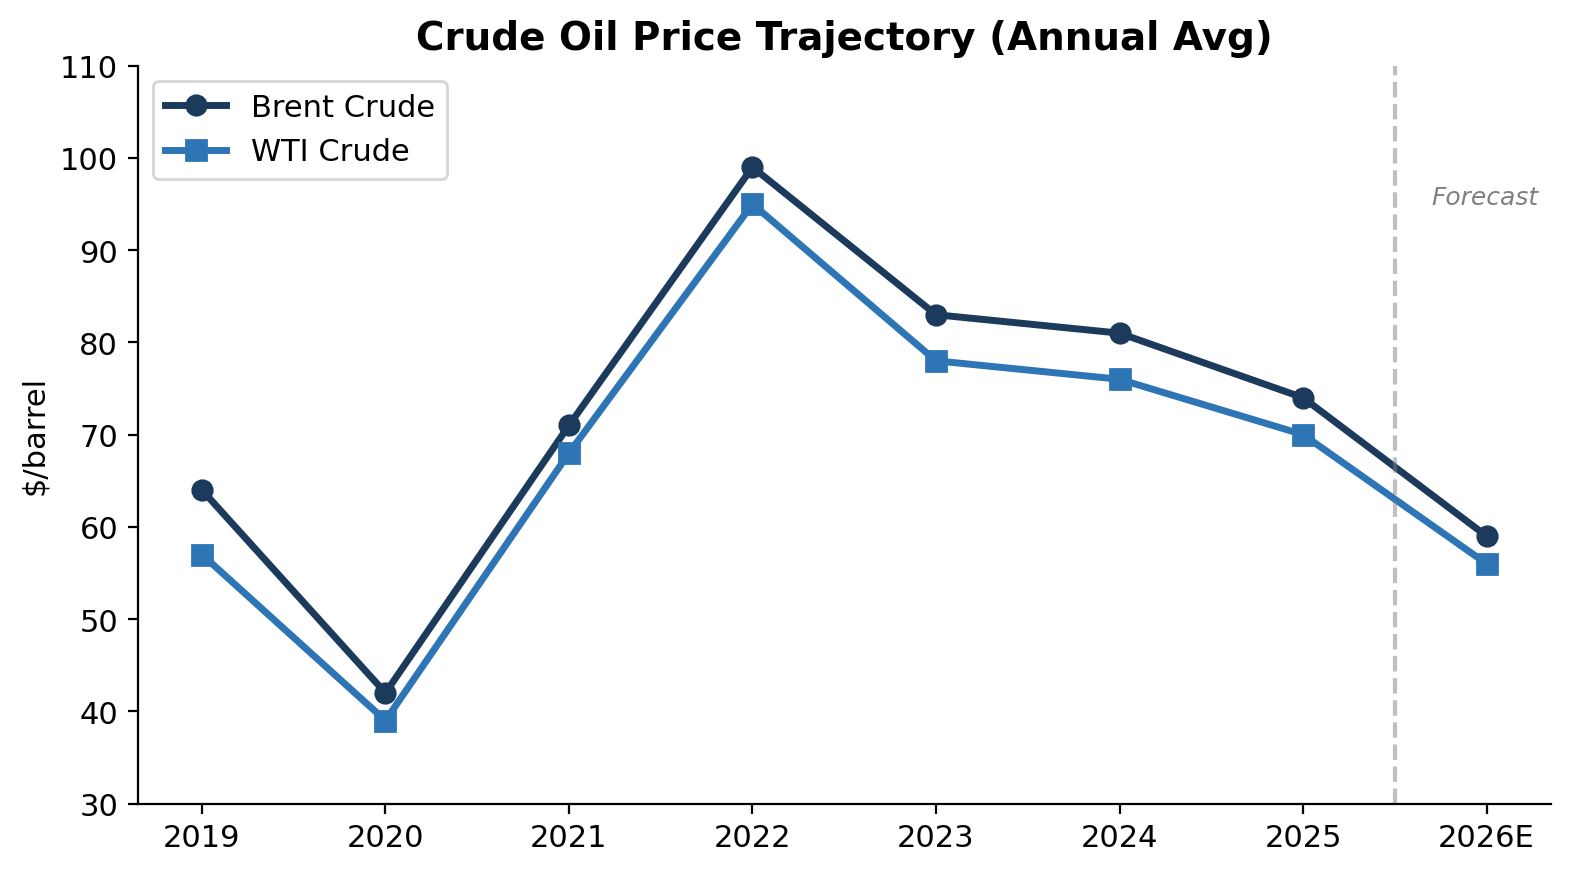
Crude oil prices have experienced the most extreme volatility since the 2020 pandemic-era dislocation. As of April 3, 2026, Brent crude trades at approximately $109/bbl and WTI at ~$112/bbl, representing a rare structural inversion where WTI commands a premium over Brent. This reflects US traders pricing in Iran conflict duration risk and the relative security of US domestic supply versus seaborne crude.
The pre-crisis consensus forecast had Brent averaging approximately $59/bbl for 2026 (EIA March STEO base case), reflecting substantial oversupply with global liquids growth of 2.5 million b/d overwhelming demand growth of 0.7 million b/d. Goldman Sachs estimated a $14-18/bbl geopolitical risk premium embedded in current prices and warned that prices could exceed the 2008 record of $147/bbl if Hormuz disruptions persist through May.
Key price dynamics:
- Brent peaked at approximately ~$126/bbl on March 8 before retreating on reports of partial humanitarian shipping corridors
- The IEA estimates global oil supply plunged 8 mb/d in March as Gulf producers saw total production cut by at least 10 mb/d due to transit disruptions
- Once Hormuz flows normalize, the IEA projects inventories building by 1.9 mb/d through 2026 and 3.0 mb/d in 2027, implying a massive potential price correction
- The US DOE initiated a 172 million barrel emergency exchange from the Strategic Petroleum Reserve (current level: ~415 million barrels) and issued an RFP for 86 million barrels
- War-risk insurance premiums have surged 4-5x above pre-war levels
Agency forecasts for 2026 oil demand growth diverge sharply, reflecting deep uncertainty about the war’s economic impact:
| Agency | 2026 Demand Growth | Supply Growth | Key Assumption |
|---|---|---|---|
| OPEC | 1.4 mb/d | Managed | Unchanged for 5 consecutive months |
| IEA | 640 kb/d | -8 mb/d (March) | War-driven demand destruction |
| EIA | 1.0-1.1 mb/d | +1.3 mb/d non-OPEC | Partial normalization by H2 |
1.4 OPEC+ Supply Management & Production Decisions
OPEC+ agreed on March 1 to begin unwinding voluntary production cuts with a 206,000 b/d increase starting April 2026, with Saudi Arabia and Russia each contributing 62 kb/d. Total effective OPEC+ cuts remain at approximately 5.86 mb/d (~5.7% of global demand). The April 5 meeting is described as the most consequential since November 2020 and will determine May production levels.
The production increase is largely academic given Hormuz constraints. Saudi Arabia’s East-West pipeline to Yanbu (~5 mb/d capacity) and the UAE’s Habshan-Fujairah pipeline provide bypass capacity covering only approximately 25% of normal Hormuz transit volumes. Key OPEC+ compliance dynamics include Kazakhstan’s persistent overproduction (which has been a source of tension) and the group’s commitment to a phased unwinding of 2.2 mb/d of voluntary cuts over 18 months.
Three scenarios for the April 5 meeting have been outlined by analysts: (1) continued 206 kb/d monthly increases as planned, (2) a pause on unwinding to support prices and avoid adding barrels that can’t reach market through Hormuz, or (3) an accelerated increase to demonstrate spare capacity and calm markets if shipping channels begin reopening.
1.5 Non-OPEC Supply Growth & US Production
US crude production is forecast at 13.6 mb/d for 2026 (EIA March STEO), rising to 13.8 mb/d in 2027, establishing the US as the world’s dominant swing producer. The Permian Basin alone produces over 6 mb/d, with ExxonMobil’s post-Pioneer position at 1.8 mb/d and Diamondback’s post-Endeavor/Double Eagle position at ~800+ kboe/d.
Guyana’s Stabroek block has emerged as one of the most prolific global developments. ExxonMobil started production at the fourth FPSO (Yellowtail, 250,000 bopd nameplate) in August 2025, pushing total Stabroek output to approximately 900,000 bopd across four vessels (Liza Destiny, Liza Unity, Payara/Prosperity, Yellowtail). The fifth project (Uaru, 250,000 bopd) is expected online in 2026, targeting total Stabroek capacity exceeding 1.3 million bopd by 2027.
Non-OPEC supply growth estimates range from 0.6 mb/d (OPEC) to 1.3 mb/d (IEA), led by the US, Brazil (Buzios FPSO ramp-ups), Canada (Trans Mountain expansion impact), Guyana, and Argentina (Vaca Muerta shale).
2. Global Energy Investment & Capital Flows
2.1 Record $3.3 Trillion in Total Investment
The IEA’s World Energy Investment 2025 report documents a record $3.3 trillion in total global energy investment, representing a ~10% increase year-over-year. Clean energy technologies accounted for $2.2 trillion, now double the $1.1 trillion flowing into fossil fuel supply. This 2:1 clean-to-fossil ratio has widened from roughly 1.2:1 just five years ago, marking a structural shift in global energy capital allocation.
2.2 Clean Energy Investment Breakdown
| Category | 2025 Investment | YoY Change | Key Detail |
|---|---|---|---|
| Solar PV | ~$450B | +15% | Single largest investment line item globally |
| Electricity Grids | ~$400B | +16% | Critical bottleneck; 2,500+ GW in queues |
| Battery Storage | ~$66B | +30%+ | 100 GW annual installations milestone |
| Nuclear | ~$70B+ | +50% vs 5yr ago | 65-70 reactors under construction globally |
| Wind | ~$150B+ | +5% | Offshore gaining share; 33 GW under construction |
| EV Infrastructure | ~$100B+ | +20% | Charging networks scaling with 25% EV penetration |
2.3 Fossil Fuel Investment Trends
Upstream oil and gas investment reached just under $570 billion in 2025, a decline of approximately 4% year-over-year per the IEA. National oil companies (NOCs) continue to drive the majority of upstream spending, particularly Saudi Aramco ($52.2 billion capex in 2025 against $50-55 billion 2026 guidance), ADNOC, and QatarEnergy. International oil company (IOC) spending has plateaued as companies prioritize returns over production growth, with the notable exception of ExxonMobil’s aggressive capacity expansion program.
3. Industry Structure & Value Chain
3.1 Value Chain Overview
The energy value chain spans exploration and production (upstream), transportation and storage (midstream), refining and distribution (downstream), and increasingly, power generation and retail (integrated utilities). Value accrual has historically been concentrated in upstream operations during high commodity price environments, but the midstream segment has offered more stable, fee-based returns that have attracted income-oriented investors.
Downstream refining margins have been volatile, while the renewables segment is seeing value creation shift from manufacturing (where oversupply has compressed margins, particularly in solar modules, with Chinese module prices falling below $0.10/W) toward project development, grid integration, and energy storage. The emergence of power generation as a strategic asset class, driven by AI data center demand, has fundamentally revalued utility and independent power producer (IPP) businesses, as evidenced by Constellation Energy’s 300%+ stock price appreciation since 2023.
3.2 Barriers to Entry
The traditional oil and gas industry has high barriers to entry, including enormous capital requirements (a single deepwater well can cost $100M+), technical complexity, regulatory permitting, and long development timelines (5-10 years from discovery to production). Resource access is heavily concentrated among national oil companies, which control approximately 70% of global reserves.
The renewables space has lower barriers on the manufacturing side (particularly solar, where Chinese producers have driven dramatic cost reductions to below $0.10/W for modules), but project development requires land access, grid interconnection (timelines now stretch to 4+ years in most US markets), permitting expertise, and increasingly, battery storage integration. Nuclear energy has the highest barriers of any energy source, with construction timelines of 7-15 years, capital requirements of $5-10 billion per GW-scale reactor, and regulatory approval processes that can take 3-5 years.
3.3 Consolidation Trends
The sector has entered an intense, multi-year consolidation phase across nearly every sub-segment. In US shale, the mega-mergers of 2024-2025 (ExxonMobil-Pioneer, Chevron-Hess, ConocoPhillips-Marathon, Diamondback-Endeavor) have given way to the Devon-Coterra $58 billion merger of equals announced in February 2026, creating the largest Delaware Basin operator with 1.6+ million boe/d production.
In the power and utilities space, Constellation Energy’s $26.6 billion acquisition of Calpine creates the largest US power producer at ~55 GW, positioning the combined company as the dominant supplier of power to data centers. Midstream M&A is being driven by the strategic importance of infrastructure for LNG exports and gas processing, with pipeline operators systematically outbidding PE firms for quality assets.
4. Key Trends & Drivers
4.1 The Renewable Revolution: Capacity Records & Policy Headwinds
Global renewable capacity additions reached record levels in 2025. IRENA reports 692 GW of additions, lifting installed capacity by a record 15.5% year-over-year. The IEA estimates approximately 520 GW of net additions (the divergence reflects differing methodologies around gross versus net capacity). Total installed renewable capacity reached approximately 5,150 GW by year-end, representing 49.4% of global installed electricity capacity for the first time.
Solar PV dominated with approximately 600-650 GW of global installations in 2025, accounting for ~80% of all renewable capacity growth. Wind installations surged with 72.2 GW added in the first half alone, up 63.7% from H1 2024 (WWEA). Offshore wind commissioned 8.8 GW globally, with 33 GW under active construction across 12 countries. China accounted for 52% of global offshore wind capacity.
Renewables overtook coal for the first time in H1 2025, reaching 34.3% of global electricity generation versus coal’s 33.1% (Ember). Solar’s share rose from 6.9% to 8.8% of the global electricity mix. Solar and wind together met 100% of electricity demand growth in H1 2025.
China’s policy pivot is the single biggest risk to global renewable deployment. China’s NDRC “Document 136” reform, introduced in February 2025, fundamentally changed renewable economics by requiring market-based pricing (UK-style Contracts for Difference) for all wind/solar projects commissioned after June 1, 2025. This triggered a rush of installations pre-deadline, followed by an 85% collapse in June installations. CRU Group forecasts a global contraction from 637 GW (2025) to ~609 GW (2026) for solar, potentially as low as 550 GW under adverse conditions. Xi Jinping’s September 2025 NDC target of 3,600 GW of wind and solar by 2035 represents only ~200 GW/year, a meaningful slowdown from recent pace.
US policy retrenchment is accelerating. The IRA had mobilized $321 billion in private clean energy investment through Q1 2025 (Rhodium Group/MIT Clean Investment Monitor), creating over 406,000 clean energy jobs across 751 projects. However, the “One Big Beautiful Bill” effectively terminated Section 25C/25D residential credits, eliminated clean vehicle credits for most vehicles, repealed tech-neutral electricity credits for projects not starting construction within 60 days, and terminated the clean hydrogen credit seven years early. E2 estimates ~$35 billion in investments have already been canceled, with 38,000+ jobs lost. The IEA has revised US renewable growth expectations down by approximately 50%.
Europe remains committed to its targets. The EU has surpassed its 320 GW solar interim target (reaching ~338 GW by end-2024) and is targeting 42.5% renewable share of energy consumption by 2030, up from 25.2% in 2024. The EU legislated a full phase-out of Russian gas imports, with long-term LNG contracts from Russia banned from January 1, 2027.
4.2 AI & Data Center Power Demand
Data center electricity consumption is the fastest-growing category of power demand in modern history. US data centers consumed 176 TWh in 2023 (4.4% of total US electricity, per DOE/LBNL) and are projected to exceed 400 TWh by 2030, an increase of 240 TWh from 2024 levels (+130%). Globally, data centers consumed approximately 415 TWh in 2024 (IEA), projected to reach 945 TWh by 2030, equivalent to Japan’s total power consumption.
The top five US hyperscalers have announced a staggering $710 billion in combined capex for 2026 alone (JLL). Alphabet planned up to $185 billion in 2026 capex, Amazon exceeded $100 billion in 2025, and Meta guided $64-72 billion. The Stargate Project (OpenAI, SoftBank, Oracle) announced $500 billion in AI infrastructure, though the Abilene, Texas expansion beyond 1.2 GW was canceled in April 2026 due to power constraints.
Nuclear procurement has become the hyperscalers’ strategy of choice:
| Company | Nuclear Deal | Capacity | Timeline | Key Details |
|---|---|---|---|---|
| Microsoft | Constellation (Three Mile Island restart) | 835 MW | 2027 (accelerated) | 20-year PPA; $1.6B investment; $1B DOE loan |
| Amazon | Talen Energy (Susquehanna) | 1,920 MW | Through 2042 | Expanded PPA; $20B PA data center investment |
| Meta | Multiple (Constellation, Vistra, Oklo, TerraPower) | ~7.7 GW | 2027-2035+ | Largest nuclear portfolio commitment by a tech company |
| Kairos Power (SMRs); Elementl Power | 500 MW+ | 2030-2035 | First commercial SMR order; Duane Arnold restart |
Natural gas plant buildout for data centers has tripled, with the US planning over 250 GW of new gas capacity (Global Energy Monitor). Texas alone has 80.6 GW in development, nearly one-third of all planned US gas buildout. Google has reportedly considered natural gas without carbon capture in its data center strategy. GE Vernova entered 2026 with 83 GW of gas power equipment under firm order, signing 24 GW of new contracts in Q4 2025 alone.
Grid constraints are acute. PJM (the nation’s largest grid operator) forecasts 32 GW of peak load growth from 2025-2030, with data centers comprising 30 GW of that increase. PJM consumers face approximately $100 billion in extra electricity costs through 2033. ERCOT has ~432 GW in its interconnection queue, with forecast load growth of ~10% annually. Grid connection timelines now stretch to 4+ years in most markets. S&P Global projects US data center grid demand rising from 61.8 GW (2025) to 134.4 GW by 2030. Texas is poised to overtake Northern Virginia as the nation’s data center development capital.
4.3 The Nuclear Renaissance
Nuclear energy is experiencing a genuine renaissance driven by three converging forces: AI data center baseload demand, energy security imperatives post-Hormuz, and climate commitments requiring firm zero-carbon generation. Globally, 65-70 reactors are under construction in 15 countries, one of the highest levels in 30 years. More than 40 countries now include nuclear in their energy strategies. The IEA projects global nuclear capacity could grow 33-70% by 2035.
Investment in nuclear exceeded $70 billion in 2025, up 50% over five years. US government investment commitments include $2.7 billion in domestic uranium enrichment, $80 billion in aggregate Westinghouse reactor investments through Cameco/Brookfield, and $800 million for TVA and Holtec SMR deployment. The DOE’s Nuclear Expansion Executive Order aims to add 200 GW of new generation capacity, triple nuclear energy production, and build 100 new reactors by 2050.
Small Modular Reactors (SMRs) are advancing toward commercial deployment, though timelines remain uncertain. NuScale’s Voygr design is the only SMR with NRC design certification. Kairos Power’s Hermes reactor received a construction permit in 2024, with Google as anchor customer. TerraPower’s Natrium reactor (345 MW, sodium-cooled fast reactor with molten salt storage) is under construction in Wyoming with Meta as a committed customer. X-energy’s Xe-100 reactor (80 MW high-temperature gas-cooled design) is pursuing deployment with Dow Chemical and Amazon Web Services.
4.4 LNG Globalization & Market Disruption
The global LNG market has been severely disrupted by the Hormuz crisis. QatarEnergy reported 17% of its LNG export capability was crippled by Iranian missile strikes on the Ras Laffan facility. The North Field East startup, previously expected in Q3/Q4 2026, faces likely delays. Qatar, which supplies approximately 20% of global LNG, has declared force majeure on multiple contracts.
Spot LNG prices have roughly doubled since mid-February:
| Benchmark | Current Price | 52-Week Low | 52-Week High | Change from Pre-Crisis |
|---|---|---|---|---|
| JKM (Asia) | $18.75/MMBtu | $9.46 | $22.35 | +95% |
| TTF (Europe) | €50.08/MWh (~$16.9/MMBtu) | €26.50 | €55.00 | +85% |
| Henry Hub (US) | $2.81/MMBtu | $1.90 | $4.20 | -5% |
The JKM-Henry Hub spread of $15.94/MMBtu creates extraordinary arbitrage incentives for US LNG exporters. Bernstein warns Dutch TTF may need to rise 40-50% further “to keep the EU lights on” if Qatari disruptions persist.
US LNG export capacity stands at approximately 15.4 Bcf/d with major projects ramping: Plaquemines LNG (2.6 Bcf/d total), Corpus Christi Stage 3 (1.4 Bcf/d, 4 of 7 trains online), and Golden Pass LNG (2.4 Bcf/d, ~90% complete). Six US LNG projects reached FID in 2025, an all-time record for the US sector at over 83 bcm/yr. The US is on track to reach ~19 Bcf/d by end of 2026 and potentially 30+ Bcf/d by the early 2030s. Global LNG trade hit a record 429 million tonnes in 2025, with the US surpassing 111 million tonnes.
European gas storage stands at a concerning ~39% full as of March 25 (AGSI+), down 18.5% from the prior year and 30.4% below the five-year average. The EU faces a challenging path to meet its mandatory 90% fill target by autumn 2026. The EU’s January 2026 regulation banning Russian gas imports phases in from April 25, 2026 (short-term LNG) through September 30, 2027 (long-term pipeline), removing Russia’s remaining ~13% share of EU gas supply.
4.5 Energy Storage: Passing the 100 GW Milestone
The global energy storage market surpassed 100 GW in annual installations for the first time in 2025 (Wood Mackenzie), with cumulative installed capacity reaching ~270 GW / 630 GWh. China accounted for 54-61% of global storage installations; the US held 27% share. Battery storage investment reached $66 billion in 2025.
Lithium-ion battery pack prices fell to a global average of $108/kWh (BloombergNEF), with LFP packs averaging just $81/kWh and stationary storage packs plunging 45% to $70/kWh. China produces the cheapest packs at $84/kWh, while North American packs run 44% higher and European packs 56% higher.
The four-hour duration lithium iron phosphate (LFP) battery has become the dominant utility-scale technology, but longer-duration storage solutions (8-100+ hours) are advancing, including iron-air (Form Energy), zinc-based (Eos Energy), and compressed air systems. The IRA’s standalone storage investment tax credit (30%+) has been a significant deployment catalyst, though its future under the “One Big Beautiful Bill” is uncertain.
4.6 Capital Discipline & Shareholder Returns
The oil and gas industry has undergone a structural shift toward capital discipline since the pandemic. Companies are maintaining lower reinvestment rates, prioritizing free cash flow generation, and returning capital through dividends and buybacks. The top five Western majors returned approximately $150 billion to shareholders in 2024-2025 combined through dividends and buybacks. ExxonMobil alone returned $37.2 billion in 2025 ($17.2 billion dividends + $20 billion buybacks). Shell has reduced its share count by 22% through $3.5 billion quarterly buybacks maintained for 14 consecutive quarters.
This discipline has improved return on capital employed and supported valuations despite lower commodity prices. ExxonMobil’s free cash flow yield stands at approximately 5.4% on an enterprise value basis ($28.2 billion FCF on $521.9 billion EV), while BP offers approximately 10%+ FCF yield on its depressed valuation.
4.7 Key Headwinds & Risks
Commodity price volatility: The Hormuz crisis has demonstrated that prices can move $40-60/bbl in weeks. Once flows normalize, the IEA projects an underlying oversupply of 3.8 mb/d, which could crash prices toward the EIA’s $59-70/bbl range.
Regulatory and policy uncertainty: The “One Big Beautiful Bill” has effectively gutted US IRA clean energy incentives, with an estimated ~90% reduction (Clean Coalition). China’s Document 136 reform has disrupted global solar deployment. European policy remains supportive but faces implementation challenges.
Tariff impacts on energy equipment: New Section 232 tariffs effective April 6, 2026, impose 50% duties on commodity steel, aluminum, and copper imports, with 25% on derivative products. Wood Mackenzie estimates US solar projects will be 54% more expensive than European equivalents and 85% more expensive than Chinese under trade tensions scenarios. Pipeline, LNG terminal, and utility-scale infrastructure costs are all rising.
Geopolitical risk: The dual-chokepoint threat (Hormuz + Bab el-Mandeb/Red Sea from Houthi resumption) is unprecedented. Saudi Arabia’s East-West pipeline to the Red Sea coast, the primary Hormuz bypass, lies within Houthi strike range.
Grid infrastructure bottleneck: Over 2,500 GW of projects remain stalled in connection queues globally. Fifty percent of US grid assets are over 20 years old, and transformer prices have reached 2.6x pre-pandemic levels with lead times nearly doubled. The IEA estimates transmission spending needs to exceed $200 billion/year by the mid-2030s.
5. Energy Transition: EVs, Batteries, Hydrogen & CCUS
5.1 Electric Vehicle Adoption
Global EV sales reached 20.7-20.9 million units in 2025, representing approximately 25% of all new passenger vehicles sold worldwide. China dominated with 12.9 million units (63% of global volume), crossing 53% EV share of new car sales. Europe grew 27-33% to ~2.3 million BEVs. The US lagged with just 1% growth to ~1.6 million units (~8% BEV market share), further pressured by the elimination of federal EV tax credits on September 30, 2025, which caused Q4 BEV sales to fall 31% YoY. BYD overtook Tesla as the global BEV leader with 2.26 million units versus Tesla’s 1.64 million (down 8.5% YoY).
The EV transition represents a structural headwind for oil demand, with the IEA estimating that EVs displaced approximately 1.5 mb/d of oil demand in 2025, growing to 5-6 mb/d by 2030. However, the pace of displacement varies dramatically by geography, with China accounting for the vast majority of near-term demand destruction.
5.2 Battery Cost Curves
Battery pack prices continued their decline to a global average of $108/kWh in 2025 (BloombergNEF), with BEV packs crossing the critical $99/kWh threshold for the second consecutive year. LFP packs averaged just $81/kWh, while stationary storage packs plunged 45% to $70/kWh. China produces the cheapest packs at $84/kWh, while North American packs run 44% higher and European packs 56% higher. The cost parity milestone for EVs versus ICE vehicles (widely estimated at ~$100/kWh at the pack level) has essentially been reached in China and is approaching in other markets.
5.3 Carbon Capture & Storage
Carbon capture scaled significantly in 2025, with operational projects rising 54% to 77 facilities (Global CCS Institute). Capture capacity exceeded 50 Mtpa (IEA), while investment tripled since 2022 to $6.4 billion. The project pipeline totals 628 projects with 513 Mtpa capacity, but this remains far below the 1,300 Mtpa needed for net-zero pathways. ExxonMobil is the sector leader, with its Houston-area CCS hub and $17.5 billion low-carbon solutions segment capex planned through 2027.
5.4 Hydrogen Economy
Hydrogen development continues at a slower pace than anticipated. Only approximately 1.75 GW of electrolyzer capacity is deployed globally, with over 1,500 projects announced across 70+ countries representing over 0.5 TW of planned capacity, but only $75 billion of the $680 billion pipeline has reached FID. The NEOM Green Hydrogen project ($8.4 billion, 4 GW) is under construction for 2026 operations. Green hydrogen costs stand at $2.30/kg (alkaline) and $3.19/kg (PEM) on the US Gulf Coast, but the early termination of the IRA hydrogen tax credit under the OBBBA has significantly dampened the US hydrogen outlook.
5.5 Grid Infrastructure: The Critical Bottleneck
Grid infrastructure investment is on track to exceed $470 billion in 2025 (+16% YoY per BloombergNEF), with the IEA estimating that transmission spending needs to exceed $200 billion/year by the mid-2030s. Over 2,500 GW of projects remain stalled in connection queues globally. Fifty percent of US grid assets are over 20 years old, and transformer prices have reached 2.6x pre-pandemic levels with lead times nearly doubled. The grid is increasingly recognized as the binding constraint on both renewable deployment and data center expansion.
6. Competitive Landscape
6.1 Oil & Gas Majors: Q4 2025 Earnings & Strategic Updates
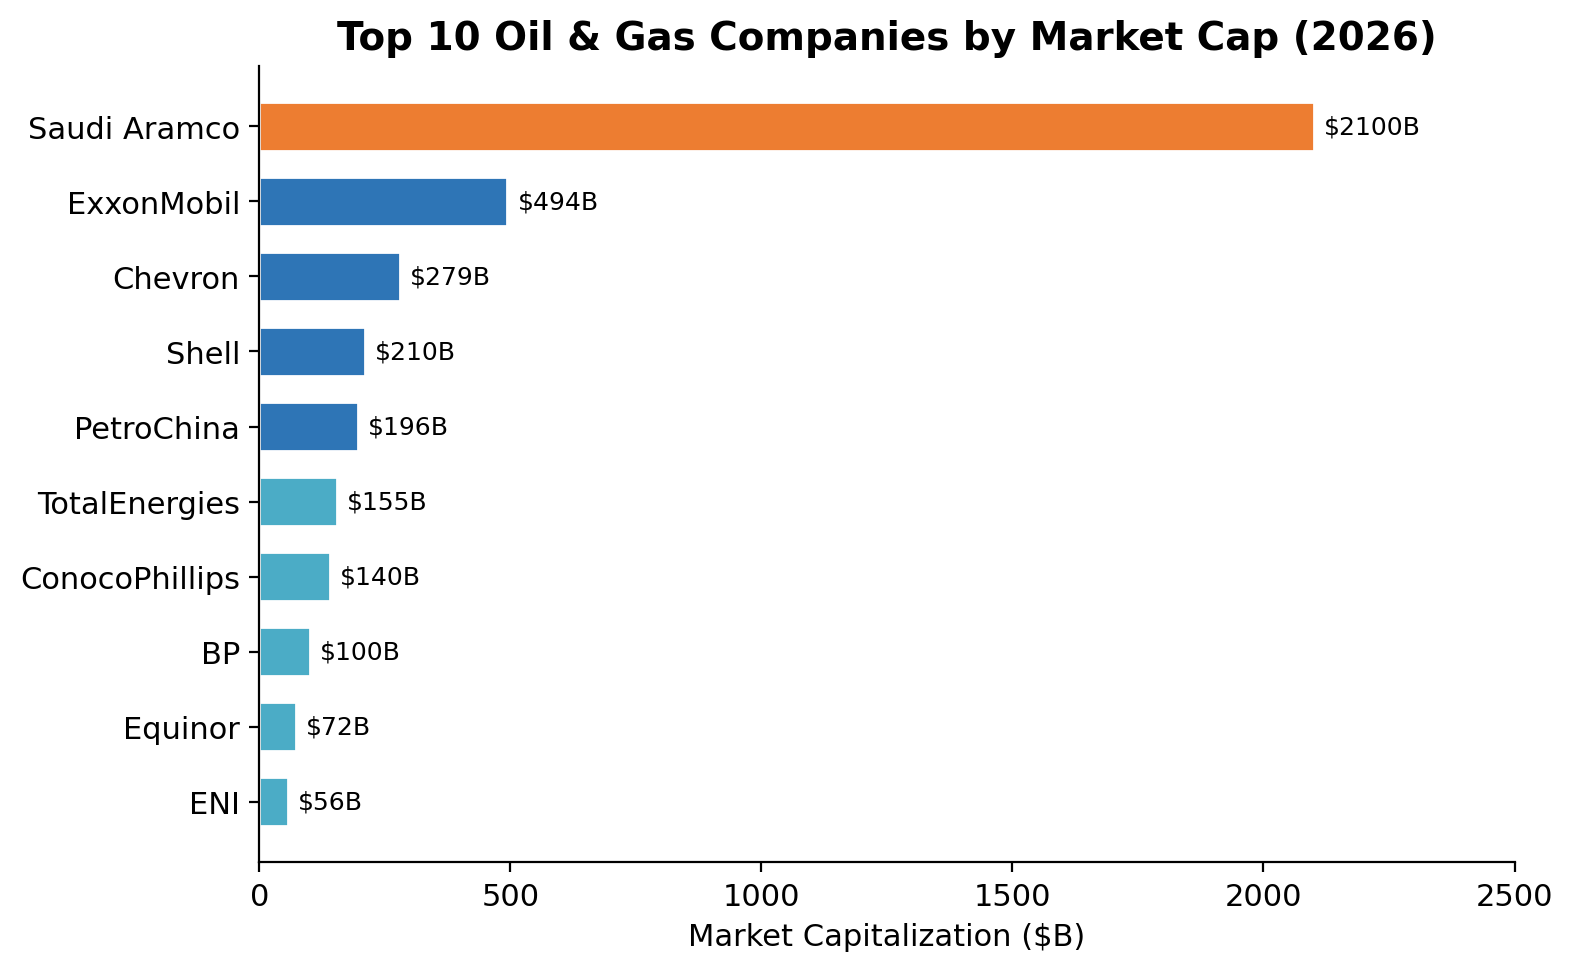
| Company | Mkt Cap ($B) | FY2025 Net Inc ($B) | Production (kboe/d) | Div Yield | P/E | Key Development |
|---|---|---|---|---|---|---|
| Saudi Aramco | $2,100 | $93.4 | ~12,000+ | ~4.5% | ~15.8x | FY25 -12% YoY; first-ever buyback ($3B); spare capacity ~3 mb/d |
| ExxonMobil | $494 | $28.8 | 5,000 (40-yr high) | ~3.3% | ~14.2x | Pioneer synergies $4B (2x initial); Permian 1.8M boe/d; $37.2B returned |
| Chevron | $279 | $12.5 | 4,045 (+20.7% YoY) | ~4.2% | ~13.5x | Hess closed; 1M boe/d Permian; $27.1B returned; 7-10% prod. growth |
| Shell | $210 | ~$15.8 | ~3,800 | ~3.8% | ~10.8x | Q4 weakest since Q1 2021; 22% share count reduction; $20-22B capex |
| TotalEnergies | $155 | $15.6 | 2,529 (+4% YoY) | ~5.2% | ~8.5x | Highest ROACE (12.6%, 4th yr); renewables 34.1 GW; elec prod +17% |
| ConocoPhillips | $140 | ~$9.5 | ~2,100 | ~3.0% | ~12.1x | Marathon integration doubled synergies; pure-play E&P capital discipline |
| BP | $100 | $7.5 | ~2,400 | ~5.4% | ~7.8x | CEO change (O’Neill from April 1); 75% capex to upstream; buybacks suspended |
ExxonMobil (XOM) delivered record production of 5.0 million boe/d in Q4 2025, with Permian output reaching 1.8M boe/d, more than tripling since 2019. Pioneer integration generated $4 billion in annual synergies, double initial estimates. The company raised its 2030 plan, targeting $20 billion in additional earnings potential and $30 billion in additional cash flow versus 2024. Capex guidance for 2026 is $27-29 billion. Q1 2026 reports April 14 with consensus EPS of $1.83.
Chevron (CVX) posted Q4 adjusted EPS of $1.52 (beat) with record production of 4,045 Mboe/d following the Hess closing in July 2025. The company achieved 1 million boe/d in the Permian with 10% less capex than planned. Full-year net income fell 30% to $12.48 billion due to lower commodity prices, but shareholder returns totaled $27.1 billion. The Hess acquisition adds transformative Guyana Stabroek exposure, with the block now producing ~900 kbopd.
Shell (SHEL) reported Q4 adjusted earnings of $3.26 billion, its weakest since Q1 2021 and missing consensus by ~7%. CEO Wael Sawan continues the “commercial realism” approach, prioritizing returns over transition investment. Shell has committed to $3.5 billion quarterly buybacks for 14 consecutive quarters and plans 2026 capex of $20-22 billion.
BP (BP) underwent the most dramatic strategic shift in the sector. The company announced a “fundamental strategy reset” that increased upstream oil and gas capex to ~$10 billion/year (~75% of group capex) while slashing transition investment to $1.5-2 billion/year, more than $5 billion below prior guidance. CEO Murray Auchincloss resigned in late 2025, with Meg O’Neill (former Woodside Energy CEO) taking over on April 1, 2026. Share buybacks have been suspended to prioritize balance sheet repair. FY2025 underlying profit was $7.5 billion. BP represents the sector’s most compelling deep value story at ~7.8x P/E with a 5.4% yield, but requires successful execution of the strategic pivot under new leadership.
TotalEnergies (TTE) stands out among European majors as the most balanced integrated energy company. Q4 adjusted net income of ~$4.4 billion beat expectations, with full-year adjusted income of $15.6 billion. The company maintained the highest ROACE among majors at 12.6% for the fourth consecutive year. Hydrocarbon production grew 4% to 2,529 kboe/d, while renewable capacity reached 34.1 GW and net electricity production surged 17% to 48 TWh.
Saudi Aramco reported FY2025 net income of $93.4 billion (-12% YoY), but adjusted net income of $104.7 billion proved the most resilient among peers. Total shareholder distributions were $85.5 billion, including the company’s first-ever share buyback program (up to $3 billion). Spare production capacity remains at ~3 million b/d. The Hormuz crisis has paradoxically benefited and harmed Aramco simultaneously: higher prices boost per-barrel revenue, but transit disruptions have physically stranded significant export volumes.
6.2 Renewables & Clean Energy Leaders
| Company | Mkt Cap ($B) | FY2025 Key Metric | Fwd P/E | Backlog/Pipeline | Key Differentiator |
|---|---|---|---|---|---|
| NextEra Energy | $167 | Adj EPS $3.71 (+8%) | 21.8x | ~30 GW development pipeline | Largest renewable generator; $55-60B investment plan through 2027 |
| GE Vernova | $95 | Backlog $150.2B (+26%) | 32.5x | 83 GW gas orders; 24 GW Q4 alone | Gas turbine + grid monopoly; AI power demand beneficiary |
| Constellation Energy | ~$80 | Acquired Calpine ($26.6B) | ~28x | ~55 GW combined capacity | Largest US power producer; nuclear fleet for AI PPAs |
| First Solar | $22 | EPS $14.21 (+16.5%) | 11.2x | 50.1 GW ($15B value) | US thin-film solar; $1.6-2.1B net cash; differentiated technology |
| Enphase Energy | $10 | Q4 Rev $343M (declining) | 28.4x | 86.4M units shipped; 160+ countries | Microinverter leader; margin pressure from tariffs |
NextEra Energy reported FY2025 adjusted EPS of $3.71 (+8% YoY) with record origination of 13.5 GW added to its ~30 GW development pipeline. The company’s $55-60 billion investment plan through 2027 positions it to capture accelerating data center demand.
GE Vernova posted a record backlog of $150.2 billion (+26% YoY), with Q4 orders surging 65%. The company raised 2026 revenue guidance to $44-45 billion and FCF to $5.0-5.5 billion. GE Vernova is the single most leveraged company to the AI power demand theme, providing gas turbines, wind equipment, and grid modernization solutions.
First Solar delivered FY2025 EPS of $14.21 (+16.5%) on $5.2 billion revenue, with a contracted backlog of 50.1 GW valued at $15 billion. Its differentiated US thin-film technology, domestic manufacturing base, and attractive valuation at 11.2x forward P/E make it a high-conviction clean energy pick.
Enphase Energy faced headwinds with Q4 revenue declining to $343 million and Q1 2026 guidance of $270-300 million, impacted by European competitive pressure and a ~5 percentage point tariff drag on gross margins.
7. M&A Activity & Deal Flow
7.1 2025 M&A Summary: $334B in Deal Value
US energy, natural resources, and chemicals deal value rose 31.3% to $333.7 billion in 2025 (KPMG), while global energy, utilities, and resources M&A climbed 27% despite a 2% decline in deal count (PwC). Twenty megadeals exceeding $5 billion were completed, up from just six in 2024. The Americas accounted for 62% of global deal value. Upstream E&P deal multiples expanded from approximately 4x EV/EBITDA in 2022 to ~6.9x in 2025 (Bain & Company).
7.2 Landmark Transactions
| Deal | Value | Multiple | Strategic Rationale |
|---|---|---|---|
| Devon Energy + Coterra (Feb 2026) | $58B (merger) | ~5.5x | Largest Delaware Basin operator; 1.6M+ boe/d; $1B synergies |
| Constellation + Calpine | $26.6B | 7.9x 2026E | Largest US power producer (~55 GW); AI data center positioning |
| Chevron + Hess (closed July 2025) | $53B | ~8x | Guyana Stabroek exposure; ~900 kbopd growing to 1.3M+ |
| ConocoPhillips + Marathon Oil (Nov 2024) | $22.5B | ~5x | Integration doubled planned synergies; Permian/Eagle Ford scale |
| Mitsubishi + Aethon Energy (Jan 2026) | $7.5B | N/A | International buying in US upstream at 7-year high |
| Diamondback + Double Eagle IV | $4B+ | ~6x | “One of the last large, high-quality private Permian assets” |
7.3 Permian Consolidation Endgame
Consolidation in the Permian Basin has created three dominant players: ExxonMobil (post-Pioneer, targeting ~2M boe/d Permian production), ConocoPhillips (post-Marathon), and Diamondback Energy (post-Endeavor and Double Eagle IV). Enverus notes that “high consolidation has left few attractive private companies for public E&Ps to target.” The focus is shifting to mid-cap mergers of equals among companies like Permian Resources, Matador Resources, HighPeak Energy, and Chord Energy.
US oil and gas upstream M&A totaled $65 billion in full-year 2025, with Q4 alone at $23.5 billion (Enverus). Average transaction size increased significantly, reflecting the premium being paid for quality remaining acreage. International buying hit a seven-year high.
7.4 Power & Utilities M&A
The power and utilities space is experiencing a surge of activity driven by AI data center demand. Beyond Constellation-Calpine, notable trends include utilities exploring behind-the-meter generation partnerships with hyperscalers, PE interest in natural gas generation assets, and grid infrastructure rollup strategies.
7.5 Renewable Energy M&A
Renewable energy M&A showed divergent trends: overall capacity transacted fell over 50% to ~12 GW (BNEF), the lowest since 2013, while standalone battery storage transaction volumes rose over 60% (FTI Consulting). Energy transition M&A as a whole reached $599 billion (+20% in value, -15% in volume per DLA Piper). Private equity is increasingly a net seller in traditional energy (all nine PE midstream exits in 2024 went to strategic buyers) while pivoting toward clean energy, with BlackRock’s GIP and EQT AB reportedly exploring acquisition of AES Corp.
8. Valuation Context
8.1 Sector Trading Multiples
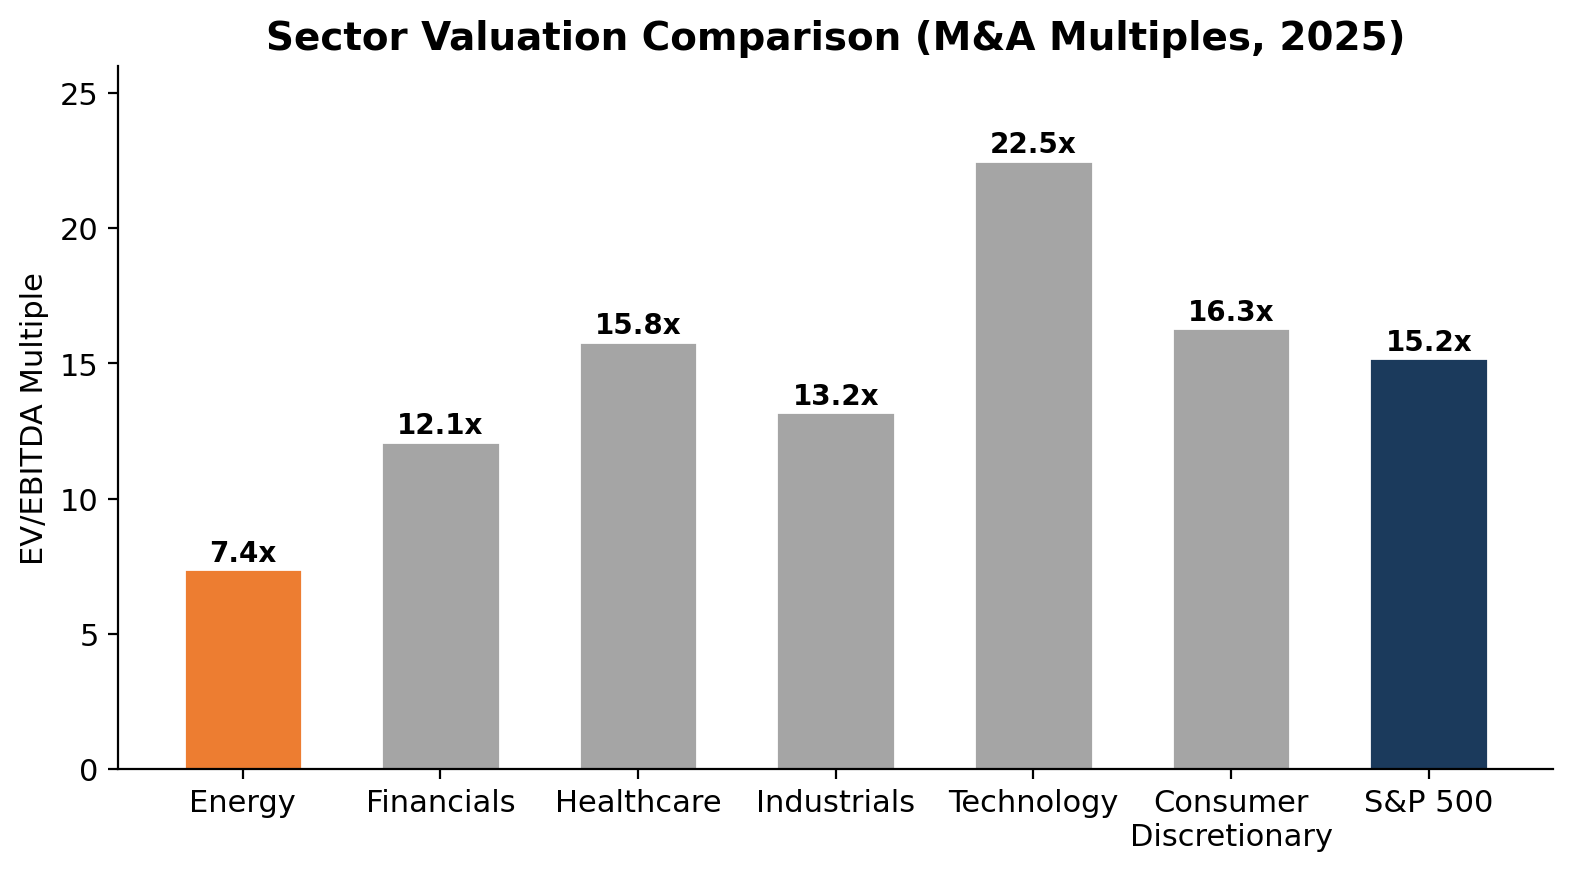
The energy sector trades at a persistent discount to the broader market. At a trailing P/E of approximately 16.6x (and approximately 7.4x EV/EBITDA on an M&A basis), energy remains among the cheapest S&P 500 sectors alongside Financials. The S&P 500 as a whole trades at ~21x trailing P/E, representing a ~25% premium to energy. Energy represents only approximately 3.5% of the S&P 500 by market cap, significantly below its historical peak of ~13% in 2008.
This discount reflects several structural factors: the cyclical nature of earnings, ESG-related fund flow headwinds (though moderating), the perceived terminal value risk from the energy transition, and the sector’s history of poor capital allocation during prior cycles. However, the current cycle has seen meaningful improvement in capital discipline, balance sheet quality, and shareholder return policies.
8.2 M&A Transaction Multiples
| Sub-Sector | EV/EBITDA Range | Trend | Commentary |
|---|---|---|---|
| Upstream E&P | 4-7x | Expanding (4x in 2022 to 6.9x in 2025) | Permian premium; Guyana premium |
| Midstream | 8-10x | Stable-to-expanding | Fee-based cash flows; strategic scarcity |
| Downstream/Refining | 5-7x | Compressing | Margin volatility; transition risk |
| Renewables | 10-14x | Compressing from 15-20x peak (2021-22) | Rate impact on project IRRs |
| Power/Utilities (IPPs) | 7-10x | Expanding sharply | AI demand rerating; Constellation-Calpine at 7.9x |
| Energy Storage | 12-18x | Premium expanding | Strategic value; AI-adjacent |
8.3 Sector Performance & Fund Flows
XLE has returned +26.4% YTD in 2026, making energy the only positive S&P 500 sector against the index’s -7.3% decline and Nasdaq’s -9.1%. The ETF trades at $59.25 (52-week range: $37.24-$63.46). Clean energy ETFs have also performed well: ICLN +14.7% YTD, TAN +19.3%, but lag traditional energy. ICLN staged a dramatic recovery in 2025 with a +50.3% return after three consecutive down years.
Zacks estimates Q1 2026 energy sector earnings growth at +7.6% (revised sharply upward from -1.9% at the start of January), with full-year 2026 growth projected at +16.3%. Energy sector revenue growth is expected at +9.3% in Q1, reflecting higher oil prices.
Among the majors, ExxonMobil commands a premium at ~24x trailing P/E on superior return on capital and Permian exposure, while BP trades at a deep ~8-10x discount reflecting strategic uncertainty and the CEO transition. Dividend yields span from ExxonMobil’s ~3.1-3.5% to BP’s ~5.3-5.4% and TotalEnergies’ ~5.2%.
8.4 Premium & Discount Drivers
Within the sector, valuation spreads are driven by: growth profile (Guyana exposure commands a premium), asset quality (low-cost Permian acreage is valued more highly than mature basins), balance sheet strength, exposure to structural growth themes (LNG, AI-related power demand, nuclear), and shareholder return consistency. European majors (Shell, BP, TotalEnergies) trade at additional discounts to US peers, partly reflecting listing-venue effects, different regulatory environments, and (in BP’s case) strategic uncertainty. Companies with credible energy transition strategies have seen less ESG-related selling pressure, though the premium for green credentials has moderated since 2022 as investors focus on returns.
9. Geopolitical Risk Assessment
9.1 Strait of Hormuz: The Defining Crisis of 2026
The Strait of Hormuz crisis represents the dominant risk to global energy security. Pre-crisis, approximately 20.9 million barrels per day of oil and 80 million tons of LNG annually transited the strait. Following Operation Epic Fury (February 28, 2026), Iran’s IRGC declared the strait “closed” on March 2. Shipping traffic has collapsed 90-95% from pre-crisis levels, from ~138 daily transits to just 53 per week. Twenty-three confirmed attacks on merchant shipping have occurred through March 31.
Iran has established a selective “toll booth” system, permitting ships from “non-hostile” nations (India, Pakistan, Turkey, China) to transit while collecting fees reportedly denominated in Chinese yuan. War-risk insurance premiums have surged 4-5x above pre-war levels, and Maersk has suspended all Hormuz and Suez/Bab el-Mandeb transits.
The resumption of Houthi attacks on March 28, 2026, creates an unprecedented dual-chokepoint risk. Saudi Arabia’s East-West pipeline to the Red Sea coast (Yanbu terminal, ~5 mb/d capacity), the primary Hormuz bypass, lies within Houthi strike range. This dual-chokepoint scenario is without modern precedent and represents the most severe potential disruption to global energy flows since World War II.
9.2 Russia-Ukraine Energy Decoupling
Russia-Ukraine energy decoupling continues, though Russia’s fossil fuel exports remain substantial. Russian gas now accounts for only ~13% of EU imports, down from ~40% in 2021. The EU’s January 2026 regulation phases out all Russian gas by late 2027. Seaborne enforcement has intensified, with the EU sanctioning nearly 600 shadow fleet vessels and Canada lowering its price cap to $44.10/bbl. Despite sanctions, Russia’s daily fossil fuel export revenues reached €492 million/day in February 2026, up 7% month-over-month, reflecting higher global prices and continued Asian demand.
9.3 US Energy Policy & Tariff Impacts
US energy policy under the Trump administration has aggressively expanded fossil fuel production while rolling back clean energy support. The DOE has declared an “energy dominance” agenda, approving LNG export capacity exceeding the world’s second-largest exporter’s total volume and rolling back EPA power plant regulations. The “One Big Beautiful Bill” cuts IRA incentives by an estimated ~90% (Clean Coalition estimate).
New Section 232 tariff actions effective April 6, 2026, impose 50% duties on commodity steel, aluminum, and copper imports, with 25% on derivative products. These tariffs raise costs for pipeline construction, LNG terminals, utility-scale solar/wind installations, and grid infrastructure. Wood Mackenzie estimates that under trade tensions scenarios, US solar projects will be 54% more expensive than European equivalents and 85% more expensive than Chinese.
9.4 Saudi Arabia’s Policy Trilemma
Saudi Arabia faces a three-way tension between its fiscal needs, OPEC+ market management, and Vision 2030 diversification goals. The Kingdom’s fiscal breakeven oil price ranges from $87/bbl (IMF central government) to $111/bbl (Bloomberg, including full PIF capex). At $100+ Brent, Saudi Arabia generates approximately $900 million/day in oil revenues. However, Goldman Sachs estimates the actual 2026 deficit at 6-6.6% of GDP ($80-90 billion) even before tariff impacts. Saudi Arabia is expected to be the largest emerging market sovereign borrower in 2026, with ~$25 billion in planned issuance. The Hormuz crisis simultaneously helps (higher prices) and hurts (disrupted exports) the Kingdom’s fiscal position.
10. Investment Implications
10.1 Best Risk/Reward Opportunities
US integrated majors (ExxonMobil, Chevron): Both offer compelling combinations of production growth, shareholder returns, and defensive qualities. ExxonMobil’s Pioneer integration provides Permian scale at 1.8M boe/d with production on a US-only basis (insulated from Hormuz). Chevron’s Guyana optionality (900 kbopd and growing) offers significant upside. Both trade at attractive free cash flow yields of 5-7% and maintain strong dividend growth track records. ExxonMobil reports Q1 on April 14.
European value plays (BP, Shell, TotalEnergies): BP represents the deepest value opportunity in the sector at ~7.8x P/E with a 5.4% dividend yield, new CEO leadership, and a return-to-hydrocarbons strategy. Shell’s LNG leadership positions it as a primary beneficiary of the Hormuz-driven LNG price surge. TotalEnergies offers the most balanced integrated energy exposure with the sector’s highest ROACE at 12.6%.
AI power demand beneficiaries (GE Vernova, NextEra, Constellation): The intersection of AI infrastructure buildout and energy is creating a structural demand tailwind for gas turbine manufacturers, renewable developers, and nuclear operators. GE Vernova trades at a premium but has unmatched order momentum ($150B backlog, 83 GW gas orders). Constellation’s 55 GW fleet and nuclear PPAs with Microsoft/Amazon/Meta position it as the toll collector on AI power demand. NextEra offers steadier compounding with its 30 GW development pipeline.
First Solar as a domestic manufacturing play: With differentiated US-manufactured thin-film technology, a massive 50.1 GW order backlog ($15B value), $1.6-2.1 billion net cash, and an attractive valuation at 11.2x forward P/E, First Solar stands out as the highest-conviction pick in clean energy, particularly in a tariff-heavy environment that favors domestic manufacturing.
LNG infrastructure beneficiaries: US LNG exporters (Cheniere, Venture Global, NEXT LNG) and midstream operators with Gulf Coast exposure benefit from the $16/MMBtu JKM-HH arbitrage spread and the structural need for European and Asian buyers to replace Qatari and Russian supply.
10.2 Key Sector Debates
Bull case: Capital discipline has fundamentally changed the oil and gas industry. Companies are generating more free cash flow per dollar of revenue than at any point in the last two decades. The sector offers compelling income and value characteristics, with dividend yields of 3-5% supplemented by aggressive buybacks. The Hormuz crisis has exposed the fragility of the “energy transition can replace hydrocarbons quickly” narrative and may drive a sustained repricing of energy security premiums. AI-driven power demand creates a structural multi-decade growth story that benefits both traditional generation (gas, nuclear) and renewables. The sector remains heavily underweight in institutional portfolios at just 3.5% of the S&P 500, creating the potential for a significant re-rating. Zacks projects +16.3% earnings growth in 2026.
Bear case: The Hormuz price spike is transitory. The IEA projects an underlying oversupply of 3.8 mb/d once disruptions end, which could crash prices toward $55-65/bbl. Long-term demand destruction from EVs (25% global penetration, 53% in China) and efficiency improvements will erode the core oil market. Battery costs below $100/kWh make solar+storage cheaper than new gas plants in most markets. OPEC+ spare capacity at elevated levels creates a permanent price ceiling. ESG fund flow headwinds will persist, capping multiples. The “One Big Beautiful Bill” may face Senate modifications that partially restore IRA incentives, benefiting clean energy relative to fossil fuels. Nuclear SMR timelines are deeply uncertain, and several hyperscaler nuclear commitments may face delays of 5-10 years.
10.3 Catalysts to Watch
Near-term (Q2 2026):
- OPEC+ April 5 meeting outcome and May production decisions
- Resolution or escalation of Strait of Hormuz tensions and Houthi dual-chokepoint risk
- Q1 2026 earnings season (ExxonMobil April 14, Chevron April 16, Shell April 30)
- IEA April Oil Market Report with updated Hormuz supply loss estimates
- US DOE Strategic Petroleum Reserve emergency exchange execution
- Section 232 tariff implementation impact on energy infrastructure costs (effective April 6)
Mid-term (H2 2026):
- Golden Pass LNG first cargo (expected H2 2026)
- Guyana Uaru FPSO commissioning (~250 kbopd)
- Three Mile Island nuclear restart progress (accelerated to 2027)
- US presidential election dynamics and energy policy implications
- China Document 136 implementation and solar deployment trajectory
- EU gas storage fill trajectory toward mandatory 90% autumn target
- LNG supply wave ramp-up from Plaquemines, Corpus Christi Stage 3, Qatar NFE
Structural (2027+):
- Peak oil demand timing and magnitude under various IEA scenarios
- Commercial SMR deployment timelines (Kairos Power, TerraPower, X-energy)
- Data center power demand trajectory vs. grid capacity build-out
- Continued M&A consolidation in US shale mid-caps and midstream
- Long-term impact of IRA rollback on US energy competitiveness vs. China/Europe
- Hydrogen economy commercial viability and cost reduction trajectory
Appendix: Sources & Methodology
This report is intended for informational purposes only and does not constitute investment advice, a solicitation, or a recommendation to buy, sell, or hold any security. Market data and financial figures are drawn from publicly available sources as of April 6, 2026. Valuations and estimates are subject to change based on market conditions.
Data Sources: IEA World Energy Outlook 2025, IEA World Energy Investment 2025, IEA Oil Market Report (March 2026), IEA Renewables 2025, Rystad Energy, Wood Mackenzie, IRENA Renewable Capacity Statistics 2026, Ember Global Electricity Review 2025, PwC Global M&A Trends 2026 (Energy, Utilities & Resources), KPMG M&A Trends in Energy 2026, Enverus 2026 Global Energy Outlook, Bain & Company Energy M&A Report, DLA Piper Energy Transition M&A Report 2026, FTI Consulting Power, Renewables & Energy Transition 2025 M&A Review, BloombergNEF Battery Price Survey 2025, Global CCS Institute Status Report 2025, WWEA Half-Year Report 2025, RenewableUK Global Offshore Wind Pipeline 2025, EIA Short-Term Energy Outlook (March 2026), OPEC Monthly Oil Market Report (March 2026), Rhodium Group/MIT Clean Investment Monitor, company filings (10-K, 20-F, 8-K), Bloomberg, S&P Capital IQ, LSEG, Statista, Grand View Research.
Geopolitical sources: Wikipedia (2026 Strait of Hormuz crisis), CNBC Strait of Hormuz crisis explainer, Al Jazeera shipping reports, United Against Nuclear Iran shipping updates, Foreign Policy (Houthi analysis), Congress.gov CRS reports, Centre for Research on Energy and Clean Air (Russian fossil fuel exports monthly analysis), EU Council press releases.
Company-specific sources: ExxonMobil FY2025 earnings release and SEC filings, Chevron Q4 2025 earnings, Shell Q4 2025 earnings, BP strategic reset announcements, TotalEnergies FY2025 results, Saudi Aramco FY2025 earnings, NextEra Energy Q4 2025 earnings, GE Vernova Q4 2025 results, First Solar FY2025 results, Enphase Energy Q4 2025 results, Devon Energy-Coterra merger announcement, Constellation Energy-Calpine acquisition filings.
All financial data, market capitalizations, and valuation multiples are approximate and based on most recently available public information. Actual figures may differ. Readers should verify current data before making investment decisions. This report was prepared as of April 6, 2026.