Executive Summary
The global Financial Services sector represents the largest single sector in the world economy at approximately $36 trillion in market scope, encompassing commercial and investment banking, insurance, asset management, private credit, payments, and financial technology. The sector is at an inflection point in early 2026, shaped by three converging forces: (1) a historic interest rate normalization cycle that has inflated bank net interest margins but is now pressuring credit quality, (2) the explosive growth of private credit as a $3.5 trillion asset class that has disrupted traditional bank lending, and (3) the early signs of stress in that same private credit market, manifested most visibly in Blue Owl’s February 2026 redemption gate on its $1.6 billion OBDC II fund and Apollo’s payout cuts.
Private credit is the sector’s defining risk theme for 2026. While bulls cite its structural advantages like floating rates, covenant-heavy structures, superior recovery rates, bears point to a troubling convergence: Fitch’s US private credit default rate hit 5.8% in January 2026 (highest since the index’s inception), PIK interest now represents 8% of total investment income at many BDCs, over $12 billion in BDC unsecured debt matures this year, and 30% of borrowers with near-term maturities carry leverage above 10x or negative EBITDA. The regulatory arbitrage that enabled private credit’s growth, no LCR requirements, mark-to-model flexibility, limited transparency, now represents the sector’s principal systemic risk vector.
Investment implications are bifurcated: traditional banking remains attractively valued at ~13.8x P/E with improving profitability, while alternative asset managers with heavy private credit exposure face a derating risk that has yet to fully materialize. The sector’s bull/bear debate is live and the outcome in 2026 could structurally reshape capital allocation across fixed income and alternatives for the decade ahead.
1. Market Overview
1.1 Market Size & Segmentation
The global financial services market reached approximately $36.1 trillion in 2025, with a CAGR of ~6.8% expected through 2030 toward a $51 trillion total. The sector is best understood through its constituent subsectors, each with distinct business models, regulatory regimes, growth profiles, and risk dynamics:
| Sub-Sector | 2024/25 Size | 5Y CAGR | Key Driver | Primary Risk |
|---|---|---|---|---|
| Global Banking & Lending | ~$14.2T rev. | 4–5% | NIM expansion | Credit cycle turn; CRE exposure |
| Insurance | ~$6.5T GWP | 5–6% | Rates; cat bond growth | Nat. cat losses; reserving risk |
| Traditional Asset Management | ~$5.8T rev. | 6–8% | Passive/ETF; wealth mgmt | Fee compression; redemptions |
| Private Credit | $3.5T AUM | +17% YoY | Bank disintermediation | ⚠ Defaults, liquidity, systemic contagion |
| Investment Banking | ~$344B rev. | 5–6% | M&A revival; ECM | Deal volume cyclicality |
| Payments & Fintech | ~$3.2T rev. | 10–12% | Digital commerce; real-time rails | Regulatory; AI disruption |
Source: The Business Research Company, McKinsey Global Banking Annual Review 2025, AIMA, Straits Research. Market sizes represent a combination of revenues, premiums, and AUM depending on subsector convention.
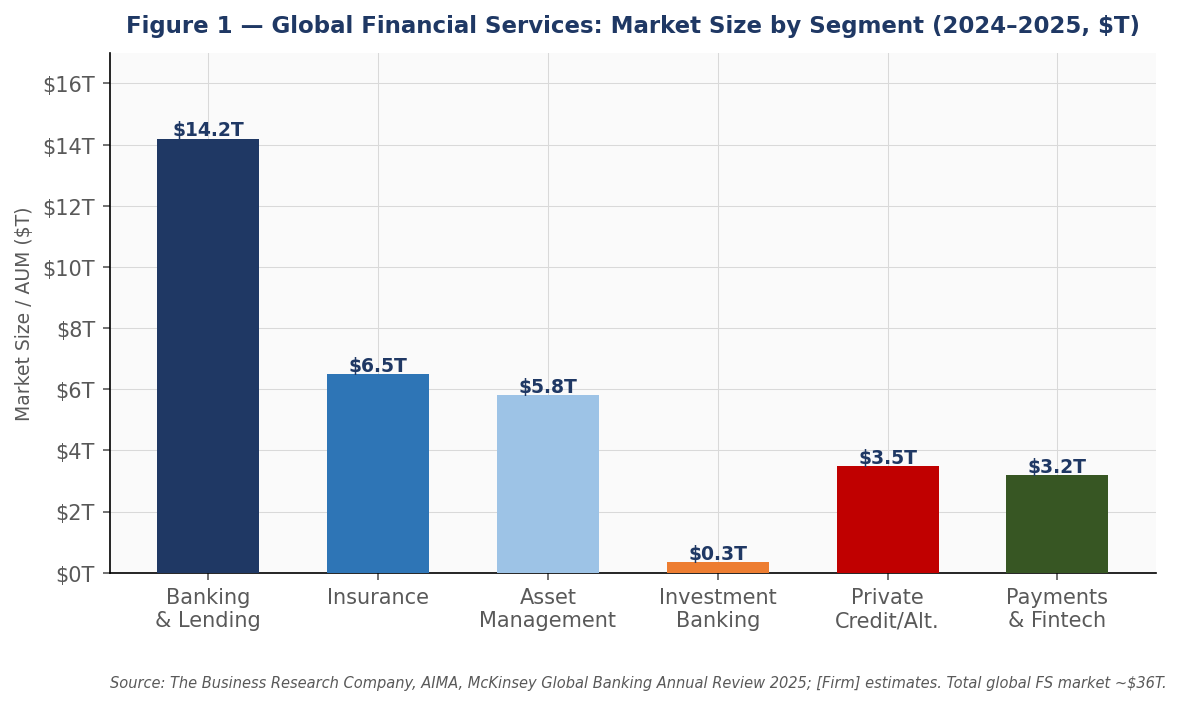
Figure 1 — Global Financial Services Market by Segment. Source: TBRC, AIMA, McKinsey (2025).
1.2 Industry Structure & Value Chain
The financial services value chain flows from capital formation (equity/debt issuance) through intermediation (banks, insurance, credit funds) to deployment (corporate lending, mortgages, consumer credit) and back through investment management (asset managers, alternative managers, BDCs) to institutional and retail capital. The defining structural shift of the past decade has been disintermediation from traditional bank balance sheets to non-bank financial intermediaries (NBFIs), particularly private credit, CLOs, and asset managers.
Banks’ revenues after risk cost reached a record $5.5 trillion in 2024 with net income of $1.2 trillion, the highest for any industry in history. This profitability was driven by elevated interest rates boosting net interest margins, with the global banking system intermediating $122 trillion in funds between 2019 and 2024 (a 40% increase). However, the beginning of rate normalization in late 2024–2025 and rising credit costs are creating a dual compression dynamic that will define bank earnings through 2026–2027.
The alternative asset manager segment, led by Blackstone ($1.1T AUM), Apollo ($730B AUM), Ares ($470B AUM), KKR, and Blue Owl, has been the fastest-growing subsector, compounding AUM at 15–25% annually. These firms occupy a structurally advantaged position: they earn management fees on locked-up capital (no redemption risk for their management companies) while deploying flexible capital across credit, real estate, and infrastructure. However, the retail-facing products they have launched such as non-traded BDCs, non-traded REITs, interval funds carry embedded liquidity mismatches that are now materializing under stress.
2. Key Trends & Drivers
2.1 Private Credit’s Explosive Growth And Its Limits
Private credit has been the defining story in financial services for the past decade. The market grew from approximately $450 billion in AUM in 2015 to $3.5 trillion by end-2024, nearly an 8x increase in ten years, driven by a confluence of structural forces: post-GFC bank regulatory tightening (Basel III/IV) pushed leveraged lending off bank balance sheets; a zero-interest-rate environment starved institutional investors of yield, driving capital to floating-rate private loans; and private equity sponsors preferred the certainty and speed of private credit execution over the volatility of public syndicated markets.
Capital deployment reached a record $592.8 billion in 2024, which is up 78% year-on-year, as post-2023 macro stability re-opened M&A and LBO markets. The market now encompasses corporate direct lending (the largest segment), asset-backed lending (mortgages, consumer loans, aircraft, infrastructure), real estate credit, and infrastructure debt.
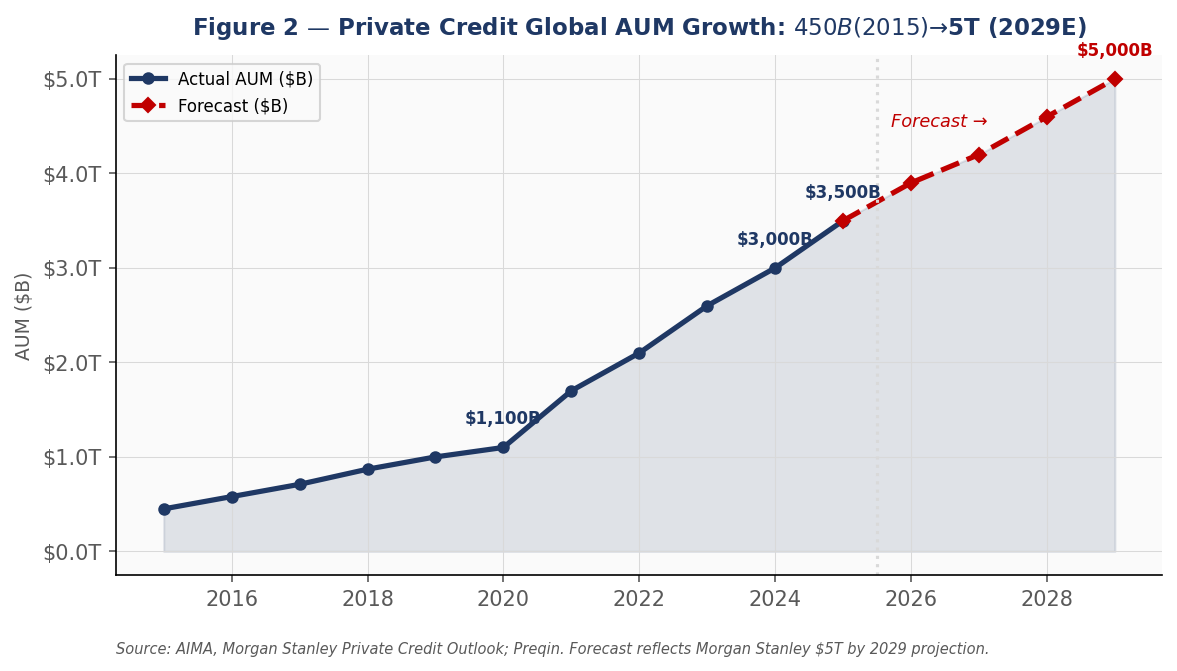
Figure 2 — Private Credit AUM Growth. Source: AIMA, Preqin, Morgan Stanley. Forecast to $5T by 2029.
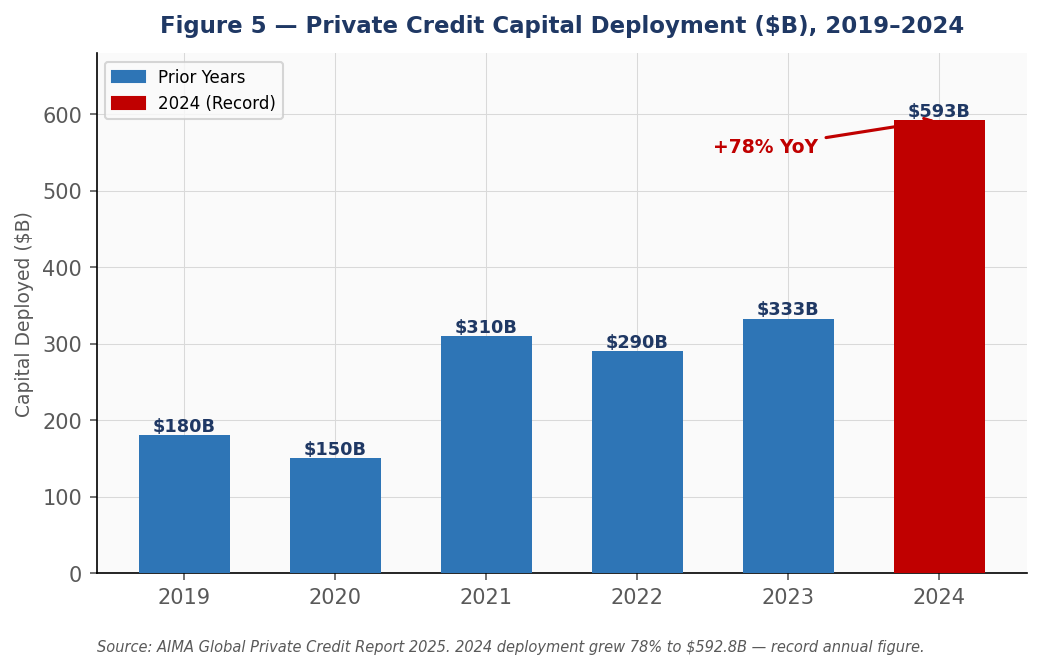
Figure 5 — Private Credit Capital Deployment ($B). Source: AIMA Global Private Credit Report 2025.
2.2 Banking Sector: NIM Expansion Masking Underlying Credit Deterioration
Commercial and investment banks have reported record aggregate profitability through 2024, riding the steepest rate-hiking cycle in four decades. JPMorgan Chase, the world’s largest bank by market cap, generated approximately $170 billion in revenues and net income of ~$55 billion in FY2024, while Goldman Sachs and Morgan Stanley both posted double-digit profit growth in 2025 as dealmaking rebounded. The investment banking TAM reached $344 billion in 2024, growing toward $562 billion by 2033 at a 5.6% CAGR.
However, beneath the headline profitability, credit quality is deteriorating across segments. Commercial real estate (CRE) remains the most acute near-term risk for regional banks, with office valuations down 40–60% from peak in major markets and $1.5 trillion in CRE debt due to mature in 2025–2026. Consumer credit quality like credit cards, auto loans is also reverting to mean after pandemic-era delinquency lows, with charge-off rates normalizing toward pre-COVID levels.
2.3 M&A and Capital Markets Revival
Investment banking fee pools staged a meaningful recovery in 2024–2025 after the 2022–2023 freeze. M&A volumes improved on the back of CEO confidence, cleaner balance sheets, and private equity firms needing to realize portfolio investments after an extended hold period. ECM activity was also robust, with NVIDIA’s equity issuance, multiple technology IPOs, and financial sponsor-backed listings all contributing to underwriting volumes.
This deal revival is a key positive for large-cap banks (JPMorgan, Goldman, Morgan Stanley, Bank of America) and creates a cyclical tailwind that partially offsets NIM compression. However, the advisory-heavy model requires sustained M&A and ECM volume, a risk given macro and geopolitical uncertainty heading into 2026.
2.4 AI & Technology Disruption in Financial Services
Artificial intelligence is beginning to meaningfully reshape financial services operations, with applications spanning credit underwriting (ML-driven scoring), trading (algorithmic execution, risk management), compliance (NLP-based AML/KYC), wealth management (robo-advisory), and customer service (conversational AI). Banks are investing heavily. JPMorgan employs over 1, 500 AI/ML specialists and has deployed AI across fraud detection, hyper-personalization, and research generation.
The competitive implications are bifurcated. Incumbents with proprietary data moats and distribution scale are best positioned to leverage AI for operational efficiency and risk management. However, fintech challengers and neobanks (Nubank, Revolut, Chime) are using AI-native architectures to undercut incumbents on unit economics in consumer banking and payments, where the cost of customer acquisition is falling rapidly.
2.5 Regulatory Tightening: Basel III Endgame and NBFI Oversight
The regulatory backdrop for financial services is tightening on multiple fronts. Basel III Endgame (US implementation) requires large banks to increase risk-weighted assets by an estimated 19%, constraining ROE and prompting further balance sheet optimization. While the Trump administration has signaled relief on some elements, the overall trajectory of capital requirements for systemically important banks (SIBs) is upward.
For NBFIs and private credit, the regulatory gap remains wide but is narrowing. The EU’s inaugural NBFI stress test is scheduled for 2026, and the Federal Reserve Bank of Boston published a major 2025 paper examining private credit’s systemic risk dimensions. Regulatory arbitrage, which means the absence of LCR requirements, mark-to-model flexibility, limited disclosure, has enabled private credit’s growth but also created the opacity that makes systemic risk assessment difficult.
3. Competitive Landscape
3.1 Major Public Companies Snapshot
The financial services competitive landscape is best analyzed across four sub-categories: (1) universal and investment banks, (2) traditional asset managers, (3) alternative asset managers with private credit exposure, and (4) insurance companies. Each category carries distinct risk/reward and responds differently to the private credit stress theme.
| Company | 2024 Rev. | Rev. Growth | ROE / Margin | Val. (P/E) | Key Risk / Priv. Credit Exposure |
|---|---|---|---|---|---|
| JPMorgan Chase (JPM) | $170B | +12% | ROE: ~17% | ~14x | CRE, consumer credit cycle; limited direct priv. credit exposure |
| Goldman Sachs (GS) | ~$53B | +16% | ROE: ~12% | ~14x | Asset mgmt (Alternatives); IB fee cyclicality |
| Morgan Stanley (MS) | ~$61B | +14% | ROE: ~14% | ~16x | Wealth mgmt concentration; IB fee upside |
| BlackRock (BLK) | ~$20B | +14% | Op. Margin: ~35% | ~22x | GIP acquisition; growing priv. credit via eFront |
| Blackstone (BX) | ~$7.5B | +20% | DE Margin: ~60% | ~26x DE | BCRED non-traded BDC liquidity; RE mark risk |
| Apollo Global (APO) | ~$7.2B | +18% | DE Margin: ~55% | ~22x DE | ⚠ BDC payout cut Feb’26; MidCap Fin. markdowns |
| Ares Management (ARES) | ~$3.8B | +22% | FRE Margin: ~42% | ~28x FRE | ⚠ Direct lending concentration; BDC ARCC exposure |
| Blue Owl Capital (OWL) | ~$2.4B | +28% | FRE Margin: ~46% | ~18x FRE | ⚠⚠ Feb’26 redemption gate; $1.4B asset sale |
Note: DE = Distributable Earnings; FRE = Fee-Related Earnings. Revenue / earnings approximations based on trailing-twelve-month estimates and company filings. ⚠ = Elevated private credit risk flag. Sources: Company filings, Bloomberg.
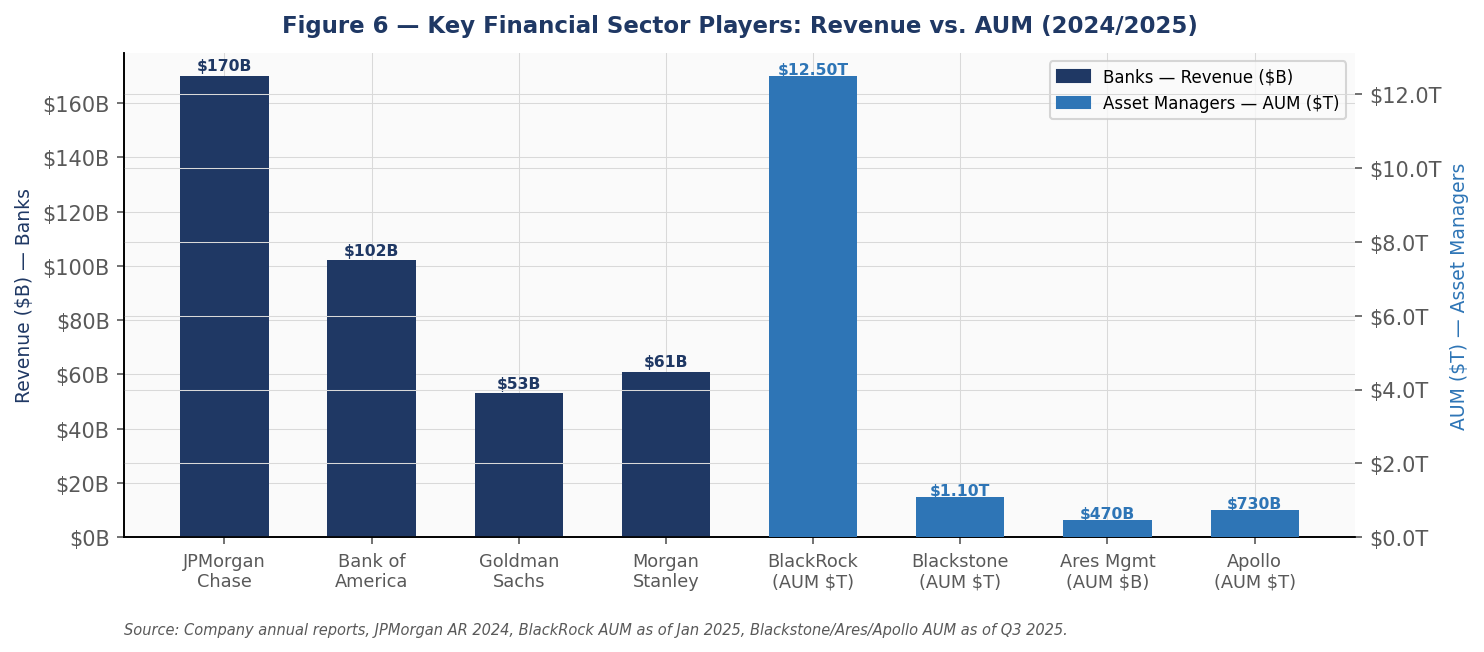
Figure 6 — Key Financial Sector Players: Revenue vs. AUM. Source: Company annual reports, Bloomberg.
Special Focus: Private Credit Risk
The section below constitutes a dedicated deep-dive on private credit systemic risk, the defining investment theme for the financial services sector in 2026. Data sourced from Fitch Ratings, KBRA, the Federal Reserve Bank of Boston, FDIC 2025 Risk Review, and real-time market events as of March 2026.
4.1 The $3.5T Market, Structural Advantages and Structural Vulnerabilities
Private credit’s structural advantages are well-documented: floating-rate loans (no duration risk), covenant-heavy structures (earlier intervention rights), direct lender-borrower relationships (negotiated workouts), and diversification benefits for institutional portfolios. Proponents point to historically lower default-to-loss ratios than public high-yield during the 2009 and 2020 stress events as evidence of resilience.
However, the market has grown into a structurally different beast than the one that navigated those prior downturns. Three critical vulnerabilities have emerged:
- Scale and concentration: The market has grown 8x since 2015 with capital flowing to ever-larger, lower-quality borrowers. The top 5–10 managers control the majority of AUM, creating concentration in deal origination that has compressed spreads and diluted underwriting standards.
- Weaker fundamentals than public markets: Private credit borrowers show interest coverage of 2.1x vs. 3.9x for comparable public companies; net leverage of 5.6x vs. 4.6x; and EBITDA margins of 14.9% vs. 16.4%. These metrics, established by KBRA and confirmed by the Federal Reserve, suggest the private credit universe has selectively captured weaker credits that could not access public markets.
- Liquidity mismatch in retail products: The expansion into non-traded BDCs, interval funds, and perpetual credit vehicles has introduced quarterly redemption features to what is fundamentally an illiquid asset class. This mismatch is structurally identical to the one that broke money market funds in 2008 and real estate funds in 2022–2023.
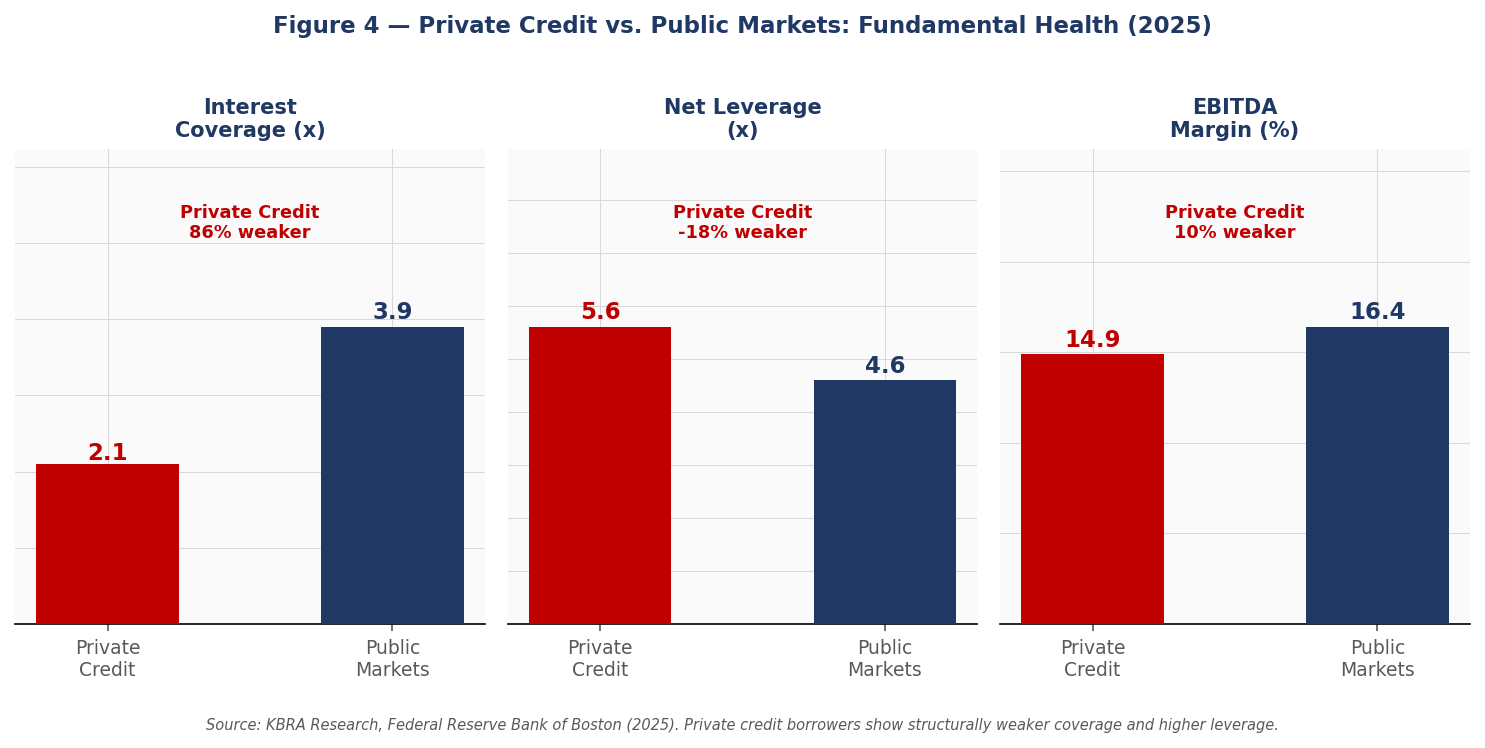
Figure 4 — Private Credit vs. Public Markets: Fundamental Health. Source: KBRA Research; Federal Reserve Bank of Boston (2025).
4.2 Default Rates: Climbing to Cycle Highs
Private credit default rates have risen materially since 2023. Fitch’s US Private Credit Default Rate Monitor, which tracks the broader universe including sponsor-backed and non-sponsored middle market borrowers reached 5.8% for the trailing twelve months through January 2026, the highest rate since Fitch began tracking the metric in August 2024. This compares to 5.6% in December 2025 and approximately 2.5% in early 2024, representing a more-than-doubling in two years.
The KBRA Direct Lending Default rate, which uses a narrower, more rigorous methodology focused on cash-pay defaults, shows 1.8% as of Q3 2025. The divergence between these two metrics reflects definitional differences: Fitch captures a broader universe including distressed exchanges and payment deferrals; KBRA focuses on formal payment defaults. Both series are trending higher.
Most concerning is the forward outlook. KBRA’s Q3 2025 Middle Market Borrower Surveillance Compendium explicitly stated: ‘Defaults Will Rise.’ The reasoning: nearly 30% of companies with maturities before year-end 2026 carry leverage above 10x or negative EBITDA, companies that cannot refinance at current rates without impairment. This maturity wall, combined with declining revenues in rate-sensitive sectors and AI-driven disruption in technology services, creates a compounding default trigger.
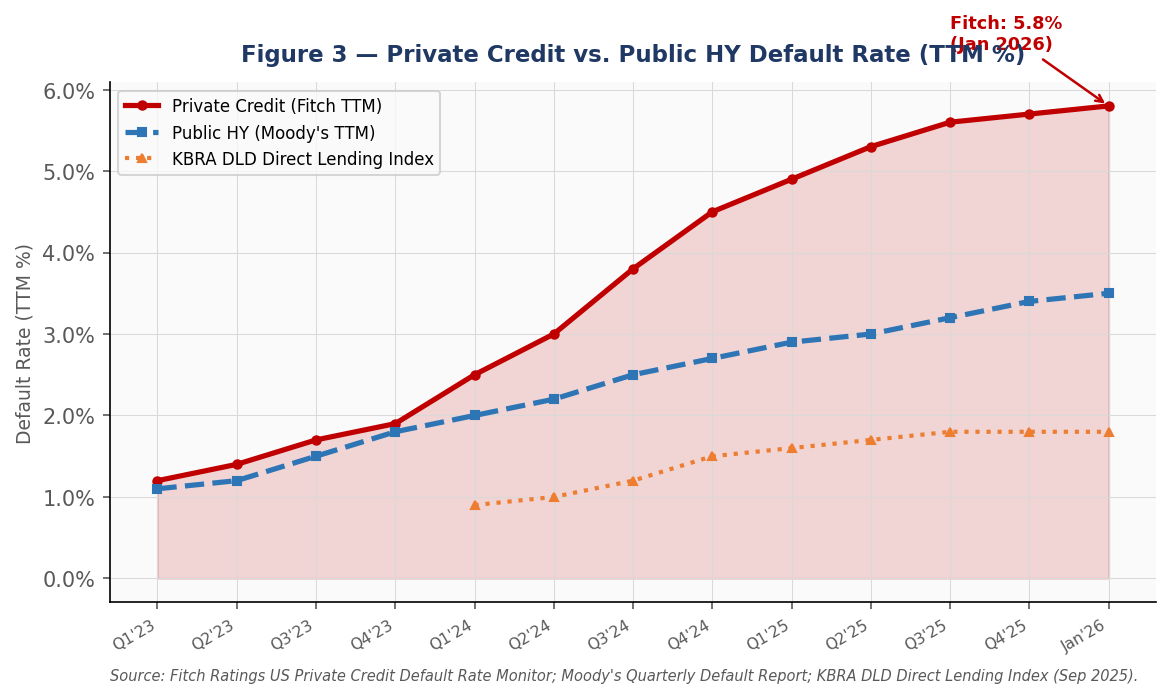
Figure 3 — Private Credit vs. Public HY Default Rate (TTM). Source: Fitch Ratings; Moody’s; KBRA DLD Index.
4.3 The Blue Owl Crisis: Anatomy of a Liquidity Event
The February 2026 Blue Owl redemption gate is the most significant stress event in private credit since the market’s modern era began, and deserves detailed examination as a harbinger rather than an isolated incident.
Blue Owl Capital’s OBDC II, a non-traded BDC with approximately $1.6 billion in net assets, received redemption requests exceeding 5% of NAV across its platform, triggering the fund’s redemption gate provisions. Its technology-focused vehicle (OTIC) saw requests jump to approximately 15% of NAV, a rate more consistent with a run than ordinary quarterly liquidity provision. Concurrently, Blue Owl executed a $1.4 billion sale of loan assets to generate liquidity, signaling that the gate was not precautionary but reactive to an actual funding stress.
The market reaction was swift: shares of Apollo, Blackstone, Ares, KKR, and TPG all fell 5%+ on the news. Jamie Dimon, JPMorgan’s CEO, referenced ‘cockroaches’ in private credit, suggesting that individual visible problems typically indicate more hidden ones. Bloomberg subsequently reported that Apollo’s MidCap Financial, one of its largest BDC platforms, cut its dividend payout and marked down assets, the second major stress event within weeks.
The structural lesson: non-traded BDCs and interval funds marketed to retail investors as ‘income vehicles’ hold illiquid middle-market loans with quarterly redemption rights. In a rising-default environment, as borrowers struggle and distributions are cut, retail investors rationally seek exits, but the underlying assets cannot be liquidated quickly without significant discount. The gap between ‘quarterly liquidity’ (promised) and ‘annual/multi-year’ liquidity (actual) is the private credit liquidity mismatch in practice.
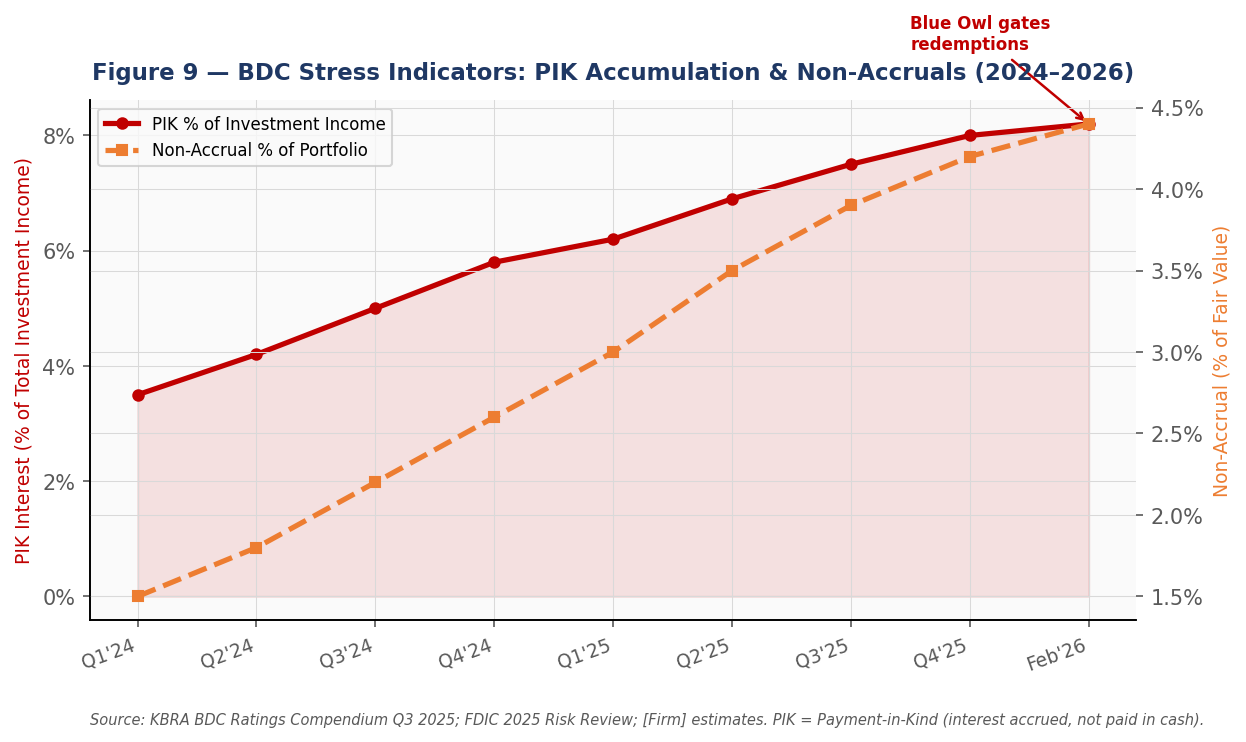
Figure 9 — BDC Stress Indicators: PIK Accumulation & Non-Accruals. Source: KBRA BDC Ratings Q3 2025; FDIC 2025 Risk Review.
4.4 Systemic Risk: Bank-Private Credit Interconnection
The Federal Reserve Bank of Boston’s 2025 research paper on private credit systemic risk identifies bank-private credit interconnection as the primary transmission channel for any private credit stress to the broader financial system. The key connections are:
- Warehouse financing: Banks provide revolving credit facilities to private credit funds for loan origination before permanent placement. These facilities, typically $500 million to $5+ billion, can experience rapid draws during market dislocations, creating unexpected bank liquidity demands.
- BDC lending: Bank lending to Business Development Companies has grown substantially as a share of bank loan portfolios. When BDCs experience stress, banks face indirect exposure to middle-market credit risk as collateral, potentially requiring significant markdowns and capital charges.
- LP commitments: Insurance companies, pension funds, and endowments have committed capital to private credit funds as limited partners. When fund values decline and capital calls are made, this creates asset-liability mismatches at institutional investors who may need to sell liquid securities to fund illiquid commitments.
- CLO/ABS repackaging: Some private credit loans are repackaged into CLOs or asset-backed securities, creating a secondary transmission mechanism to public fixed income markets. Deterioration in underlying loan quality creates feedback loops into CLO pricing and bank CLO holdings.
The Federal Reserve paper notes that the network structure of modern finance is no longer hub-and-spoke (centered on large banks, as in 2008) but rather distributed, with BDCs and NBFIs becoming more central to network connectivity. This distributed structure may be more resilient in mild stress but potentially more fragile in systemic stress, as contagion pathways are harder to identify and interrupt.
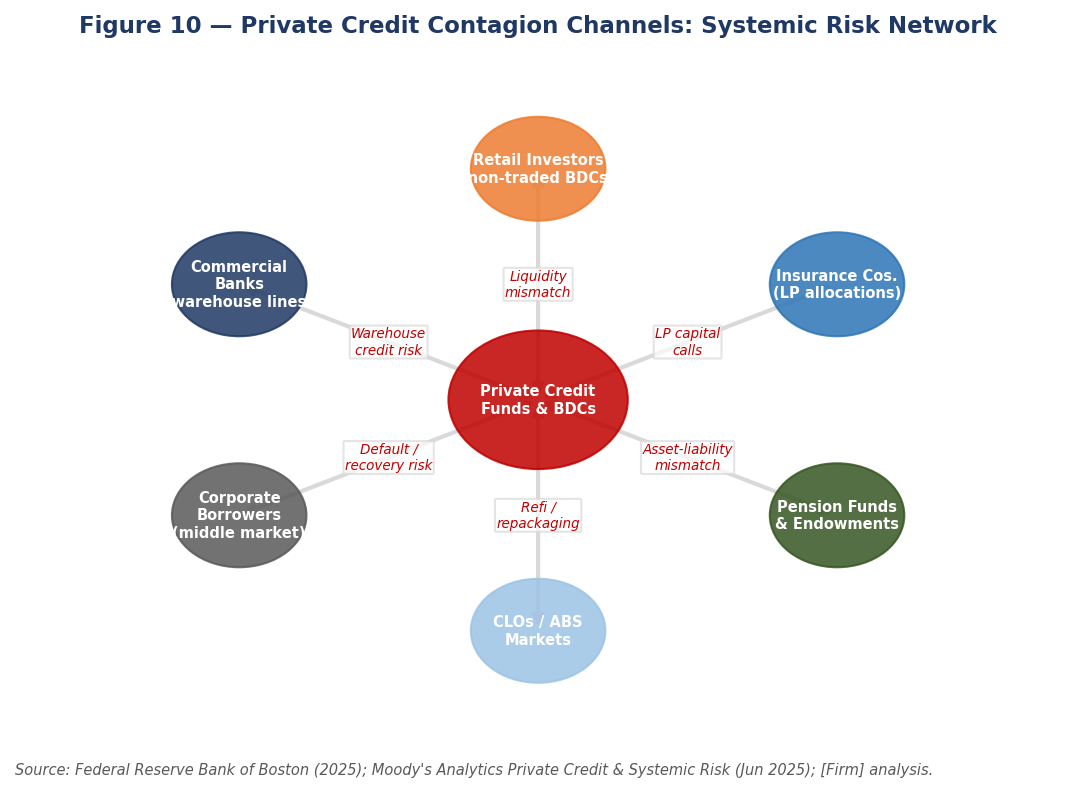
Figure 10 — Private Credit Contagion Channels. Source: Federal Reserve Bank of Boston (2025); Moody’s Analytics Jun 2025.
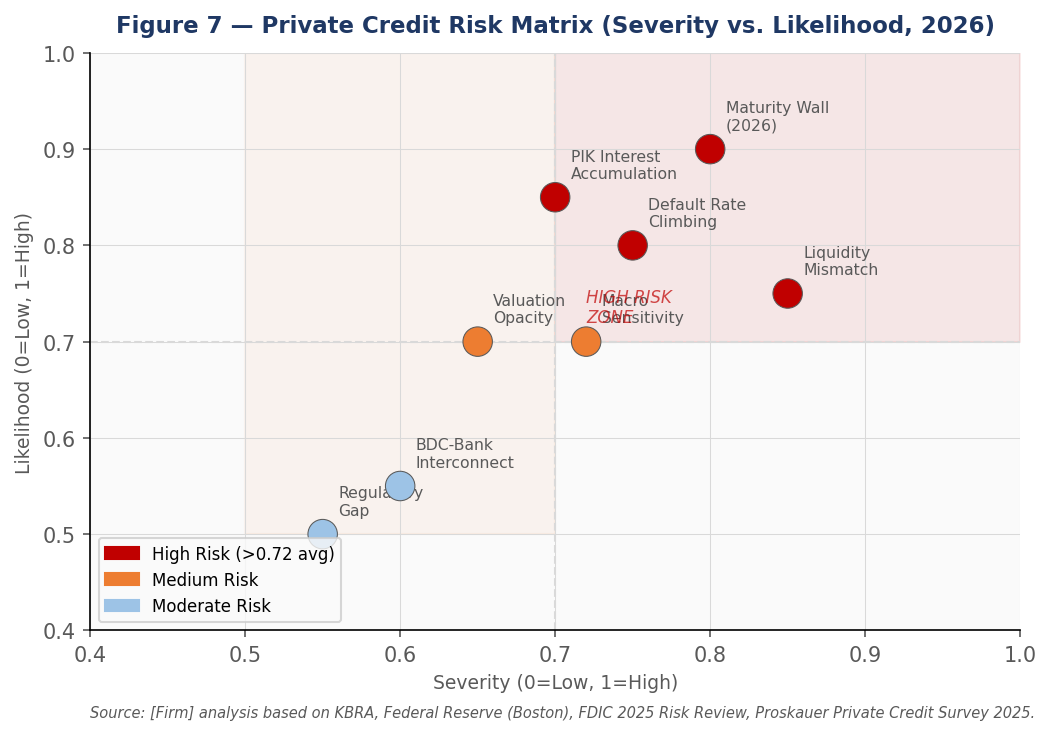
Figure 7 — Private Credit Risk Matrix (Severity vs. Likelihood). Source: KBRA; Fed Boston; FDIC.
5. Valuation Context
5.1 Sector Trading Multiples
Financial services companies are valued on sector-specific metrics: banks and insurance companies on Price-to-Book (P/B) and Price-to-Earnings (P/E), reflecting the liability-heavy nature of their balance sheets; asset managers on P/E and fee-related earnings (FRE) multiples, reflecting recurring management fee economics; and BDCs on discount/premium to Net Asset Value (NAV), which directly measures the market’s confidence in book value accuracy.
| Sub-Sector | NTM P/E | P/B | Div. Yield | Investment Note |
|---|---|---|---|---|
| Money Center Banks | ~13.8x | ~1.8x | 2.5–3.5% | Cheap vs. history; NIM peak concerns |
| Regional Banks | ~12.5x | ~1.3x | 3.5–4.5% | Discount to MCBs; CRE headline risk |
| Investment Banks | ~14.0x | ~1.5x | 1.5–2.5% | M&A cyclical recovery; moderate premium |
| Trad. Asset Managers | ~18.0x | ~2.4x | 3.0–4.0% | BlackRock premium justified by scale/diversification |
| Alt. Asset Managers | ~25x (DE) | ~5.5x | 2.5–4.0% | Premium to peers; derating risk if priv. credit stress |
| BDCs (Public, ex-stress) | ~10x | ~1.0x NAV | 8–11% | High yield, but NAV accuracy risk; cut risk |
| BDCs (Stressed / Non-Traded) | N/M | 0.7–0.9x NAV | Cuts likely | ⚠ Avoid; liquidity gate / distribution cut risk |
Source: CSIMarket, Bloomberg, Simply Wall St. (2025). BDC NAV multiples reflect market price / reported book value; under stress, book value reliability is the key debate.
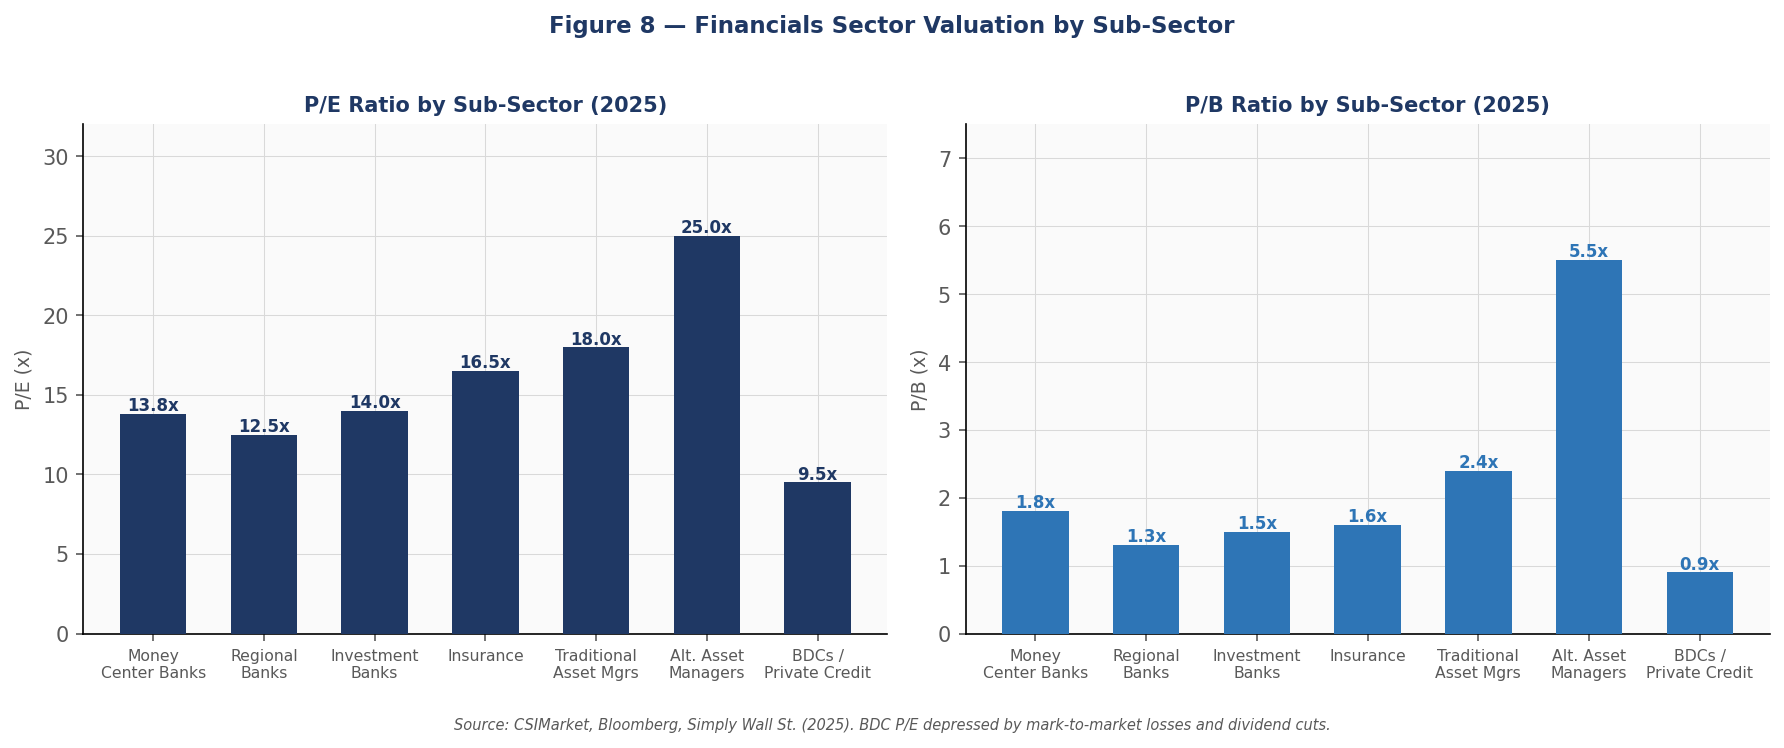
Figure 8 — Financials Sector Valuation by Sub-Sector. Source: CSIMarket, Bloomberg, Simply Wall St. (2025).
6. Investment Implications
6.1 Key Thematic Opportunities
The financial services sector’s bifurcation between well-capitalized traditional banks (cheap valuations, improving profitability) and over-leveraged private credit platforms (premium valuations, emerging credit and liquidity stress) creates specific investment opportunities and risks:
- Overweight money-center banks vs. alt. asset managers: At 13–14x P/E vs. 25x+ for alt. managers, the relative value argument for JPMorgan, Goldman, and Morgan Stanley is compelling, particularly given their disciplined balance sheet management and record fee income. The M&A revival tailwind persists into 2026.
- Selective BDC opportunities post-dislocation: High-quality, publicly traded BDCs with conservative leverage (≤1.0x D/E), senior-secured portfolio concentration, and diversified borrower bases could become attractive at significant NAV discounts (0.7–0.8x) if broader sector stress creates indiscriminate selling. ARCC (Ares Capital), FS KKR, and Golub Capital BDC are names to monitor for stress-induced entry points.
- Short/avoid non-traded BDC platforms: Vehicles with quarterly redemption features, concentrated technology-sector borrowers, and elevated PIK income represent the highest-risk segment. The combination of redemption gates, potential NAV markdowns, and distribution cuts creates a toxic spiral that retail investors typically exit at the worst prices.
- Insurance sector as defensive allocation: Life and P&C insurers benefit from high fixed-income reinvestment rates, have contained CRE exposure relative to banks, and trade at reasonable P/B ratios (1.5–1.7x). Metlife, Prudential, and Chubb offer defensive yield with improving fundamentals.
6.2 Bull vs. Bear
| BULL CASE — FINANCIALS | BEAR CASE — PRIVATE CREDIT CONTAGION |
|---|---|
| Record bank profitability continues; JPMorgan/GS dominate investment banking revival | Blue Owl/Apollo are the ‘cockroaches’ — stress is widespread in middle market; defaults accelerate through 2026 maturity wall |
| Private credit stress is idiosyncratic (Blue Owl, Apollo) not systemic; manager quality dispersion protects strong players | Retail non-traded BDC redemption wave becomes self-reinforcing; asset sales at discounts force NAV markdowns across the sector |
| Rates moderating → soft landing → credit losses contained; floating-rate private loans benefit from prolonged high-rate environment | Bank warehouse line drawdowns and BDC credit facilities create direct P&L exposure for money-center banks |
| Alt. managers’ locked-up management fees provide earnings stability regardless of market conditions | Mark-to-model opacity means reported NAVs are overstated; real losses emerge only when forced liquidations occur |
| Regulatory environment more favorable under current administration — Basel III Endgame relief for banks | Regulatory response (NBFI stress testing, LCR-equivalent requirements) compresses alt. manager economics structurally |
6.3 Key Catalysts to Watch
- Q1 2026 BDC Earnings (April–May 2026): First full quarter of results post-Blue Owl stress event. Watch for: further NAV markdowns, distribution cuts, PIK income trends, and management commentary on pipeline. This will be the most important near-term data point for the private credit thesis.
- 2026 BDC Maturity Wall: $12+ billion in BDC unsecured debt matures through 2026. Refinancing success/failure at these entities will be a direct test of capital market access for the sector.
- EU NBFI Stress Test (2026): The first EU-wide stress test of non-bank financial intermediaries provides the first regulatory quantification of systemic risk transmission from private credit to banks and insurance.
- Federal Reserve rate decisions: A rate cut cycle accelerating faster than expected would reduce interest burden on private credit borrowers but compress base-rate component of floating-rate loan returns. A pause or re-acceleration in rates would exacerbate borrower stress but support lender yields.
- M&A and LBO volumes: Private equity exit activity and new deal origination are the primary demand drivers for private credit deployment. Sustained high-volume M&A (2025 deal boom continuing into 2026) would provide new loan origination and portfolio diversification, partially offsetting vintage-year legacy stress.
Appendix: Glossary & Sources
Key Terms — Private Credit
| Term | Definition |
|---|---|
| BDC | Business Development Company — a publicly registered, closed-end fund that lends to or invests in US middle-market companies. BDCs must distribute 90%+ of taxable income and can leverage up to 2:1 D/E. |
| PIK Interest | Payment-in-Kind — where borrowers pay interest by issuing additional debt rather than cash. High PIK income signals borrower distress and deferred loss recognition. |
| Non-Accrual | A loan placed on non-accrual status when the lender no longer believes interest will be collected. Non-accruals are the leading indicator of realized losses. |
| Warehouse Line | A revolving credit facility extended by a bank to a fund to finance loan origination before permanent placement. Creates direct bank exposure to private credit stress. |
| NAV (Net Asset Value) | Reported book value of a BDC or private fund, determined by mark-to-model valuation of illiquid assets. Accuracy is a central debate during stress periods. |
| Redemption Gate | A contractual provision that limits investor withdrawals (typically to 5–10% per quarter or 20–25% per year) when redemption requests exceed a threshold. Triggers signal fund-level stress. |
Sources & References
- McKinsey Global Banking Annual Review 2025: McKinsey Global Banking review
- AIMA — Global Private Credit Market Reaches $3.5 Trillion: aima.org press release
- Morgan Stanley Private Credit Outlook ($5T by 2029): Morgan Stanley Private Credit
- Federal Reserve Bank of Boston — Could Private Credit Pose Systemic Risk?: bostonfed.org
- KBRA Private Credit Q3 2025 Middle Market Borrower Compendium: kbra.com
- CNBC — Blue Owl / Private Credit Stress: cnbc.com private credit stress
- Bloomberg — Blue Owl Redemption Halt Intensifies Private Credit Fears: Bloomberg
- FDIC 2025 Risk Review: fdic.gov 2025 risk review
Important Disclosures
This report is prepared for informational and research purposes only and does not constitute investment advice or a solicitation. All market size figures, financial data, and estimates are sourced from publicly available materials as of March 2026. Estimates and projections are independent analysis and may differ materially from outcomes. Private credit risk analysis draws on publicly available regulatory and industry research. This is not legal, regulatory, or financial advice. Investors should conduct their own due diligence.
This analysis is produced for informational and research purposes only. For further information, visit shaoxiongyuan.github.io.