| Global Market | 5-Yr CAGR | GLP-1 TAM | M&A (2025) | Median EV/EBITDA | Patent Cliff |
|---|---|---|---|---|---|
| $9.25T | 5.2% | $105B by 2035 | $138B / 129 Deals | 11.5x | $120B+ at Risk |
Table of Contents
- Executive Summary
- Market Overview & Sizing
- Key Trends & Thematic Drivers
- Competitive Landscape
- Valuation Context
- Investment Implications
- Risk Factors & Structural Headwinds
- Appendix: Sources & Methodology
Executive Summary
The global healthcare sector stands at approximately $9.25 trillion in 2025, growing at a ~5% CAGR driven by aging demographics, rising chronic disease prevalence, and transformative innovation across pharmaceuticals, medical technology, and digital health.1 The U.S. alone accounts for roughly $4.87 trillion of this total, with projected growth to $5.15 trillion in 2026 and an estimated $8.09 trillion by 2034 at a 5.8% CAGR. The sector is undergoing a structural shift centered on three mega-themes: the GLP-1/obesity revolution, AI-driven drug discovery, and the IRA-driven regulatory overhaul of U.S. drug pricing.
Eli Lilly has cemented its position as the dominant force in healthcare innovation. Full-year 2025 revenue reached $65.2 billion, a 45% surge driven by Mounjaro and Zepbound (combined ~$36.5 billion, or 56% of total revenue).2 Lilly guided 2026 revenue of $80–$83 billion, surpassing consensus estimates of $77.6 billion, and its market capitalization fluctuates around the $1 trillion mark, making it the first healthcare company to reach that milestone. Meanwhile, UnitedHealth Group posted record consolidated revenue of $447.6 billion in 2025 (up 12% year-over-year), though profitability was pressured by elevated medical costs, Medicare Advantage funding reductions, and residual Change Healthcare cyberattack charges.3
M&A activity accelerated in 2025 with 129 biopharma deals totaling $138 billion, while licensing deals exceeded $250 billion across 516 transactions.4 Six of the year’s ten largest M&A transactions occurred in Q4, signaling robust momentum into 2026. The patent cliff presents both risk and opportunity, with over $120 billion in peak annual revenues exposed to generic/biosimilar competition by 2028. The Inflation Reduction Act’s Medicare Drug Price Negotiation Program set prices for the first 10 drugs effective January 1, 2026, achieving 38–79% discounts from 2023 list prices and generating an estimated $6 billion in annual Medicare savings.5
Valuations are sharply bifurcated: growth assets (GLP-1, gene therapy, robotic surgery) command premium multiples of 40–55x EV/EBITDA, while legacy pharma trades at historical discounts of 10–15x. Managed care multiples have compressed to 11–13x following 2025 margin headwinds, representing a notable discount to the 5-year average of 16–18x. We see the most compelling risk/reward in: (1) diversified pharma with strong pipeline refreshes, (2) GLP-1 ecosystem enablers (CDMOs, device manufacturers, primary care infrastructure), (3) managed care names recovering from margin compression, and (4) biosimilar beneficiaries positioned to capture share from the looming patent cliff.
1. Market Overview & Sizing
1.1 Global Market Size & Segmentation
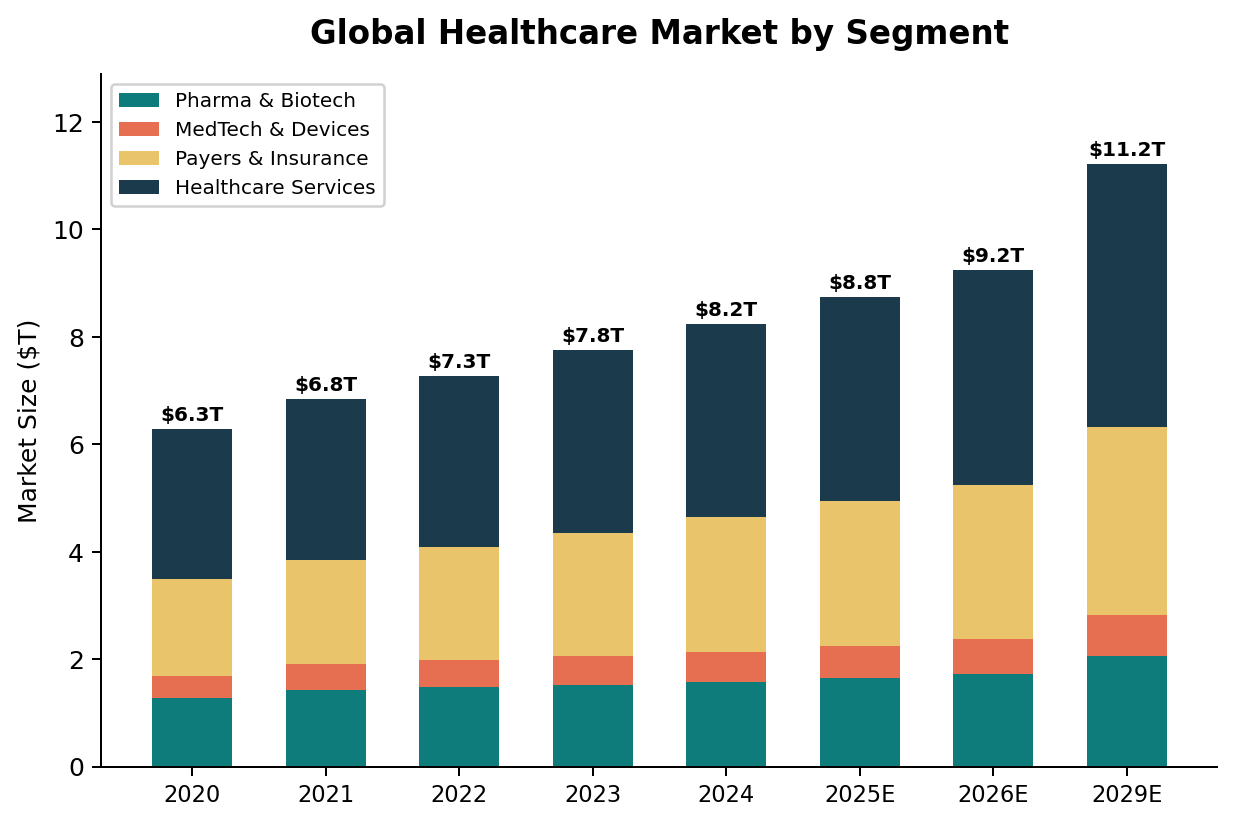
The global healthcare ecosystem encompasses four primary segments: Pharmaceuticals & Biotech ($1.65T), Medical Technology & Devices ($600B), Payers & Insurance ($2.70T), and Healthcare Services ($3.80T). The total addressable market reached approximately $9.25 trillion in 2025, growing from $6.3 trillion in 2020 at a 5-year CAGR of approximately 8%. Forecast growth moderates to ~4.9% through 2029, reaching an estimated $11.2 trillion.1
| Segment | 2024 Size | 2025E | 2029E | CAGR | Key Driver | Risk Factor |
|---|---|---|---|---|---|---|
| Pharma & Biotech | $1.58T | $1.65T | $2.05T | 5.6% | GLP-1, Oncology | Patent Cliff, IRA |
| MedTech & Devices | $560B | $600B | $780B | 6.8% | Robotics, AI Dx | Reimbursement |
| Payers & Insurance | $2.50T | $2.70T | $3.50T | 6.7% | Value-Based Care | MLR Pressure |
| Healthcare Svcs. | $3.60T | $3.80T | $4.89T | 6.5% | Aging Population | Labor Costs |
| Total Healthcare | $8.30T | $9.25T | $11.22T | 4.9% | See subsectors | See subsectors |
1.2 U.S. Market Deep Dive
The U.S. healthcare market was valued at $4.87 trillion in 2025 and is projected to reach $5.15 trillion in 2026, growing at a CAGR of 5.8% through 2034 to an estimated $8.09 trillion. Healthcare utilization remained elevated through 2025, with volume migration to lower-cost care settings and maturity in value-based care continuing to reshape strategic opportunities.6 McKinsey estimates that economic growth could create up to five million healthcare-adjacent jobs between 2026 and 2029, with one to two million individuals facing Medicaid disenrollment potentially transitioning into employer-sponsored insurance.
The expiration of enhanced ACA subsidies and policy changes under the One Big Beautiful Bill Act (OBBBA) are expected to create a challenging near-term environment: approximately 9–10 million members are estimated to exit the individual ACA market by 2026–27. This shift could worsen risk pools and compress payer EBITDA margins by 50–80 basis points. However, the market is expected to stabilize beginning in 2027 as payers implement targeted pricing strategies and Medicaid enrollees transition to ACA plans.
1.3 Industry Structure & Competitive Moats
The healthcare sector is moderately consolidated at the sub-sector level. In pharmaceuticals, the top 10 companies control approximately 45% of global revenue, with scale advantages in R&D spending ($1–3 billion per approved drug over 10–15 year timelines), regulatory expertise, and distribution. Medical technology is more fragmented, though leaders like Medtronic, Abbott, and Intuitive Surgical command dominant positions in their niches through high switching costs and recurring consumable revenue models.
Managed care is heavily consolidated in the U.S., with UnitedHealth, Elevance, Cigna, and Humana controlling approximately 70% of commercially insured lives. The value chain is shifting dramatically: payers are increasingly integrating vertically into care delivery (UnitedHealth/Optum managing 2.1 million+ incremental value-based care patients) and pharmacy benefits (CVS/Aetna/Caremark building the largest integrated care platform). This vertical integration creates winner-take-more dynamics that present structural headwinds for standalone providers and drug companies reliant on volume-based pricing.
Barriers to entry vary significantly across sub-sectors: pharmaceutical development requires $1–3 billion per approved drug; medical device companies face rigorous FDA 510(k) and PMA pathways; and managed care demands massive provider networks, actuarial capabilities, and data analytics infrastructure at scale.
2. Key Trends & Thematic Drivers
2.1 The GLP-1 / Obesity Revolution
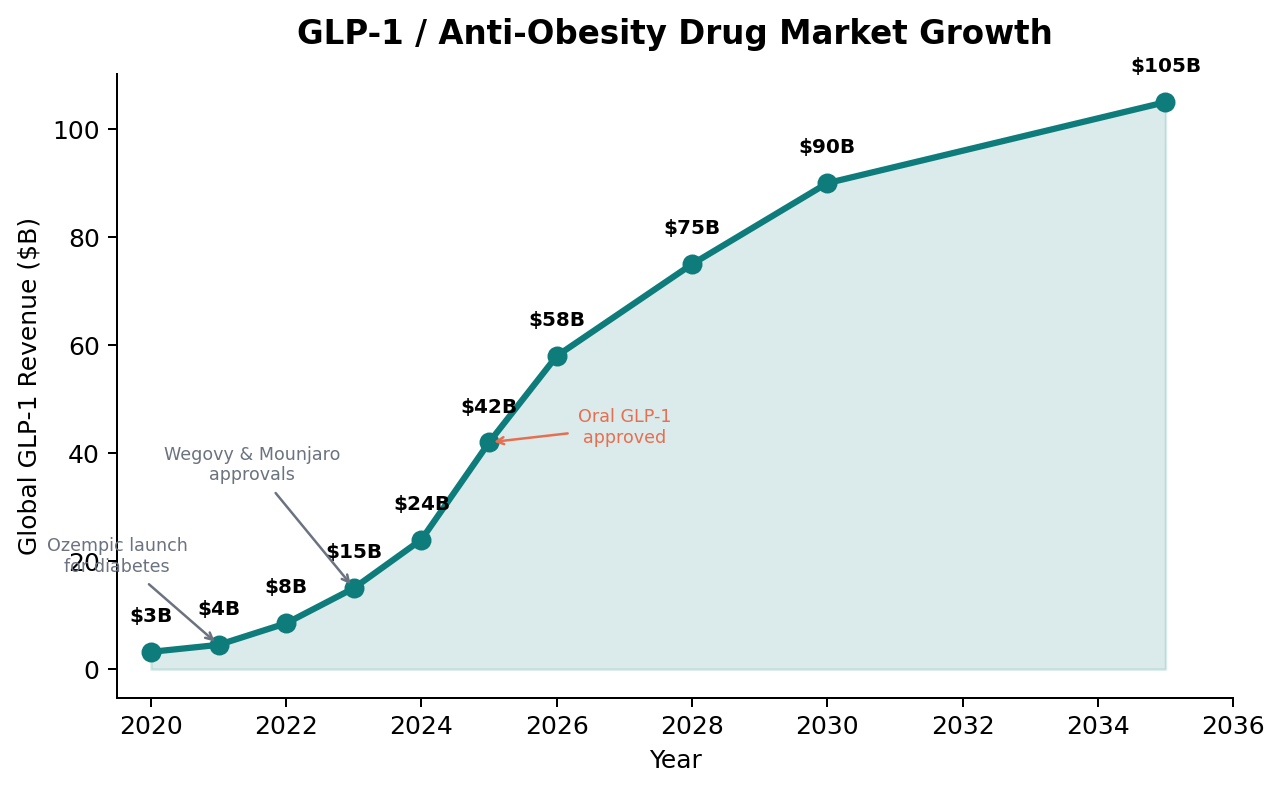
The anti-obesity drug market represents the most significant therapeutic innovation cycle since immuno-oncology. Combined GLP-1 revenues reached an estimated $42 billion in 2025, with the market forecast to approach $100 billion annually by the end of this decade and exceed $105 billion by 2035. Eli Lilly (Mounjaro/Zepbound) and Novo Nordisk (Ozempic/Wegovy) dominate, but over 160 assets spanning 68 mechanisms of action are in development globally.7
2.1.1 The Oral GLP-1 Inflection
2026 is shaping up as the year of the obesity pill. Novo Nordisk’s oral semaglutide (branded as Wegovy in pill form) received FDA approval in late December 2025 and launched commercially in early January 2026, achieving 50,000 weekly prescriptions in just under three weeks. Eli Lilly’s oral GLP-1, orforglipron, received a priority review voucher and is expected to win FDA approval by mid-2026.8
Oral formulations mark a pivotal inflection for patient access. Goldman Sachs projects pills could capture roughly 24% of the global weight-loss drug market ($22 billion) by 2030. Key advantages include: no injection anxiety, no cold-chain supply requirements (expanding reach to developing markets), and potentially lower direct-to-consumer pricing. Lilly is expected to dominate the oral segment with an estimated 60% share ($13.6 billion) versus Novo’s 21% ($4 billion), with remaining share going to emerging competitors.
2.1.2 Competitive & Pipeline Dynamics
The GLP-1 competitive landscape is diverging sharply. Lilly’s 2026 guidance of $80–$83 billion in revenue signals continued dominance, while Novo Nordisk warned of a 5–13% sales and profit decline in 2026 due to U.S. pricing pressure and expiring patent exclusivity in China, Brazil, and Canada. An estimated 20–25 million patients are currently taking GLP-1 medications globally, but penetration remains low at roughly 7% of diabetes patients and 2% of the obese population.
Beyond the two leaders, the pipeline is broadening: Pfizer acquired Metsera ($10B, obesity pipeline), Viking Therapeutics, Structure Therapeutics, AstraZeneca, and Roche are all developing rival oral or injectable agents. Novo Nordisk’s CagriSema (first GLP-1/amylin combination) and amycretin (GLP-1/amylin single-molecule agonist) represent the next-generation frontier, with Phase 3 trials initiating in early 2026. Next-gen agents promise enhanced weight loss (20%+ total body weight reduction), better tolerability, and muscle-mass preservation.
2.1.3 Policy & Access Transformation
Access barriers are falling rapidly. In November 2025, the Trump administration struck landmark deals with both Eli Lilly and Novo Nordisk to slash GLP-1 prices for Medicare and Medicaid beneficiaries, with a $50 monthly cap on patient out-of-pocket spending under the BALANCE pilot program. In return, both companies received three-year tariff exemptions. Direct-to-consumer pricing has fallen meaningfully, with both companies operating branded pharmacy channels. However, employer coverage remains contentious: while 44% of large employers covered weight-loss GLP-1s in 2024, some have dropped coverage in 2026 due to cost pressures, even as others add the newly approved oral options.
2.2 AI-Driven Drug Discovery & Healthcare IT
Despite enormous investment, AI drug discovery remains in an early but accelerating phase. A 2025 MIT report found that 95% of generative AI pilots at life sciences companies fail to scale. However, select leaders are achieving meaningful results: Recursion Pharmaceuticals and Insilico Medicine have advanced AI-designed compounds to clinical trials, and large pharma partnerships with AI firms totaled over $15 billion in 2025.
The broader healthcare IT market was valued at $354 billion in 2025 and is projected to reach $403 billion in 2026, growing at a 16.7% CAGR to $1.38 trillion by 2034. Clinical solutions (EHRs, population health management, telehealth) dominate with a 70% share. AI is proving most impactful in four areas: (1) target identification and molecular optimization, (2) clinical trial design and patient matching, (3) real-world evidence generation, and (4) operational workflow automation. The technology is less about full de novo drug creation and more about accelerating and de-risking each stage of the existing pipeline.
2.3 Regulatory Transformation: IRA & Drug Pricing
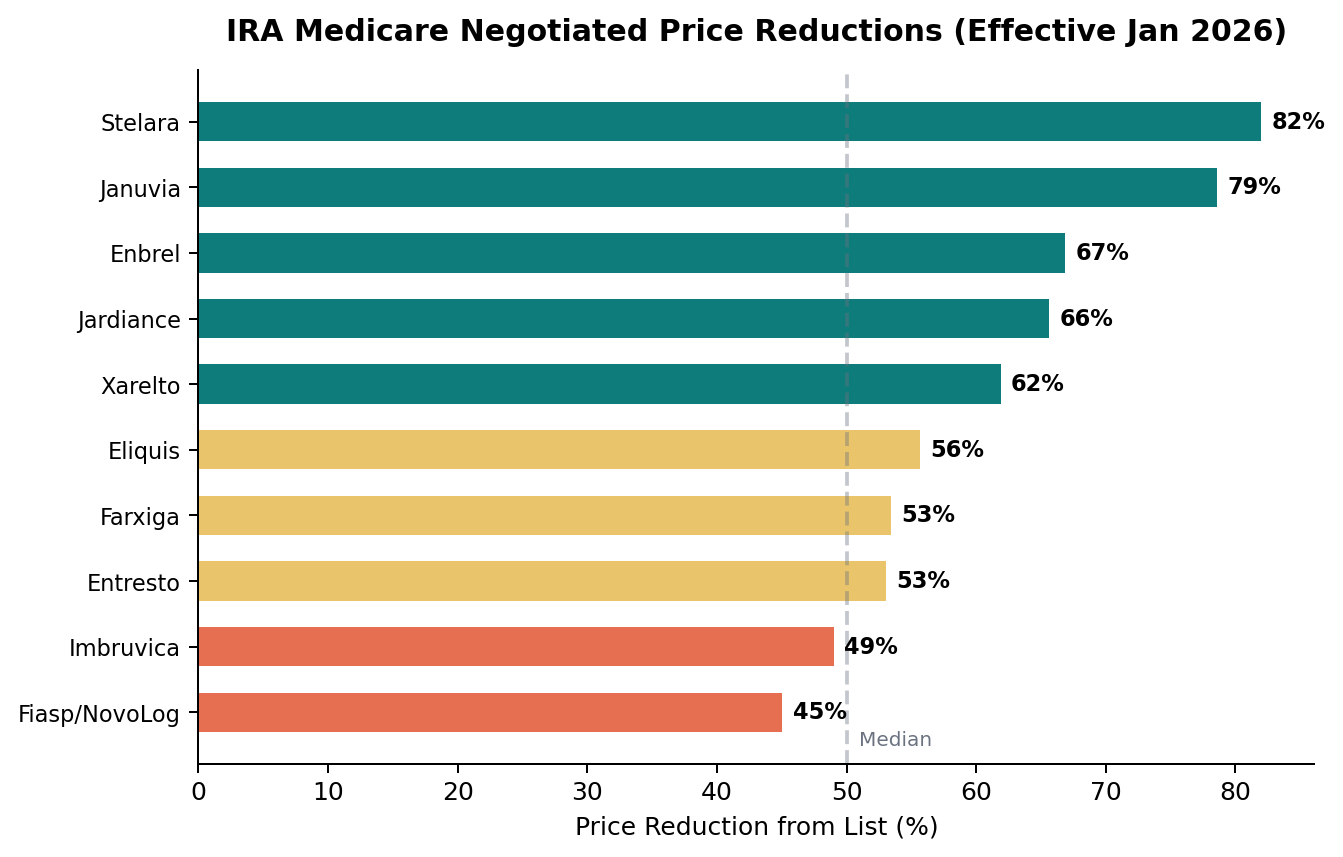
The Inflation Reduction Act fundamentally alters U.S. drug economics. The Medicare Drug Price Negotiation Program set maximum fair prices for the first 10 Part D drugs effective January 1, 2026, achieving 38–79% reductions from 2023 list prices.5 CMS estimates these negotiated prices will save Medicare $6 billion annually and reduce beneficiary out-of-pocket costs by $1.5 billion per year. The program is cumulative and expanding:
| Year | Negotiation Scope | Key Development |
|---|---|---|
| 2026 | 10 Part D drugs – prices effective Jan 1 | 38–79% discounts; $6B Medicare savings |
| 2027 | 15 additional Part D drugs | Stelara exits as biosimilars enter |
| 2028 | 15 more Part B and D drugs (first B inclusion) | Expanded orphan drug exclusion per OBBBA |
| 2029+ | 20 additional drugs per year | Keytruda/Opdivo selection delayed by reform |
Critically, the 2025 reconciliation law broadened the orphan drug exclusion, making drugs designated for multiple rare diseases ineligible for negotiation and delaying selection timelines, which effectively delayed the selection of Keytruda and Opdivo for negotiation.9 The “pill penalty” (7-year threshold for small molecules vs. 11 years for biologics) continues to distort R&D incentives, with industry estimates suggesting 188 fewer small molecule medicines will reach market as a result.
2.4 Biosimilar Adoption & the Patent Cliff
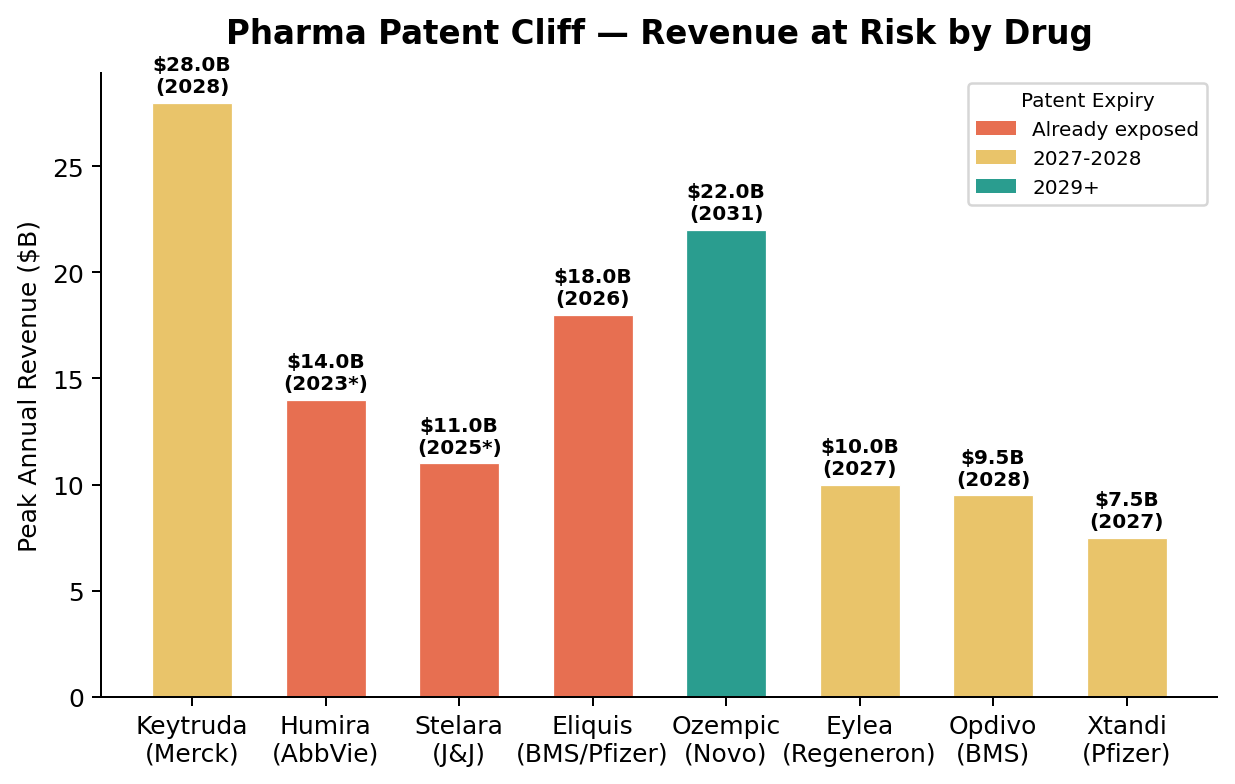
Over $120 billion in peak annual drug revenues face patent expiration by 2028, creating one of the most significant portfolio-refresh cycles in pharmaceutical history. Payers are increasingly mandating biosimilar-first step therapy and preferential formulary placement. Humira biosimilars have captured significant market share since 2023, and the upcoming Stelara and Eliquis patent expirations in 2025–2026 will further accelerate adoption.
The semaglutide patent landscape is particularly consequential. Expiration in key international markets (China, India, Brazil, Canada, Turkey) by 2027 could transform global obesity treatment, given that these countries represent ~40% of the global population and ~33% of adults considered obese. In contrast, Lilly’s tirzepatide patents are expected to hold into the back half of the 2030s in major markets, a critical competitive moat. The Biosimilars Council estimates cumulative savings exceeding $100 billion through 2030 from biosimilar adoption.
2.5 Value-Based Care & Vertical Integration
The shift from fee-for-service to value-based payment models continues to reshape healthcare delivery. According to CMS, 40% of traditional Medicare payments were tied to alternative payment models in 2023, with accountable care organizations reducing hospital admissions by 8.3% and saving $2.3 billion annually. UnitedHealth/Optum now manages over 2.1 million incremental value-based care patients, while CVS Health, through its Aetna/Caremark/Oak Street integration, is building the largest integrated care platform.
This trend favors companies with data analytics capabilities, broad provider networks, and the ability to manage total cost of care. It creates structural headwinds for standalone providers and drug companies reliant on volume-based pricing. The EY 2026 Healthcare Outlook identifies primary care as a key strategic opportunity, given that the U.S. continues to deliver lower-value care and lags peer countries in primary care access and utilization. Risk-bearing reimbursement models are driving adoption of remote monitoring, chronic disease registries, and care coordination technology.10
2.6 Emerging Themes: Digital Health, Precision Medicine & Robotic Surgery
Several additional structural themes are shaping the healthcare landscape for 2026 and beyond. Digital health, including telehealth, cloud platforms, and remote patient monitoring, continues to drive scalable, efficient, and personalized care. The FDA authorized 67 prescription digital therapeutics in 2023, and CMS has expanded reimbursement for remote therapeutic monitoring. Precision medicine and AI-enabled diagnostics are enabling identification of disease subtypes, with applications expanding beyond oncology into obesity, autoimmune conditions, and rare diseases.
The robotic surgery market has become increasingly competitive, with multiple companies broadening applications beyond urology and gynecology. Intuitive Surgical maintains dominant market share with its da Vinci platform, but challengers including Medtronic (Hugo), Johnson & Johnson (Ottava), and Stryker are investing aggressively. The global market for long-term care and home healthcare technologies is projected to grow from $46.2 billion in 2025 to $64.8 billion by 2030 at a 7% CAGR.
3. Competitive Landscape
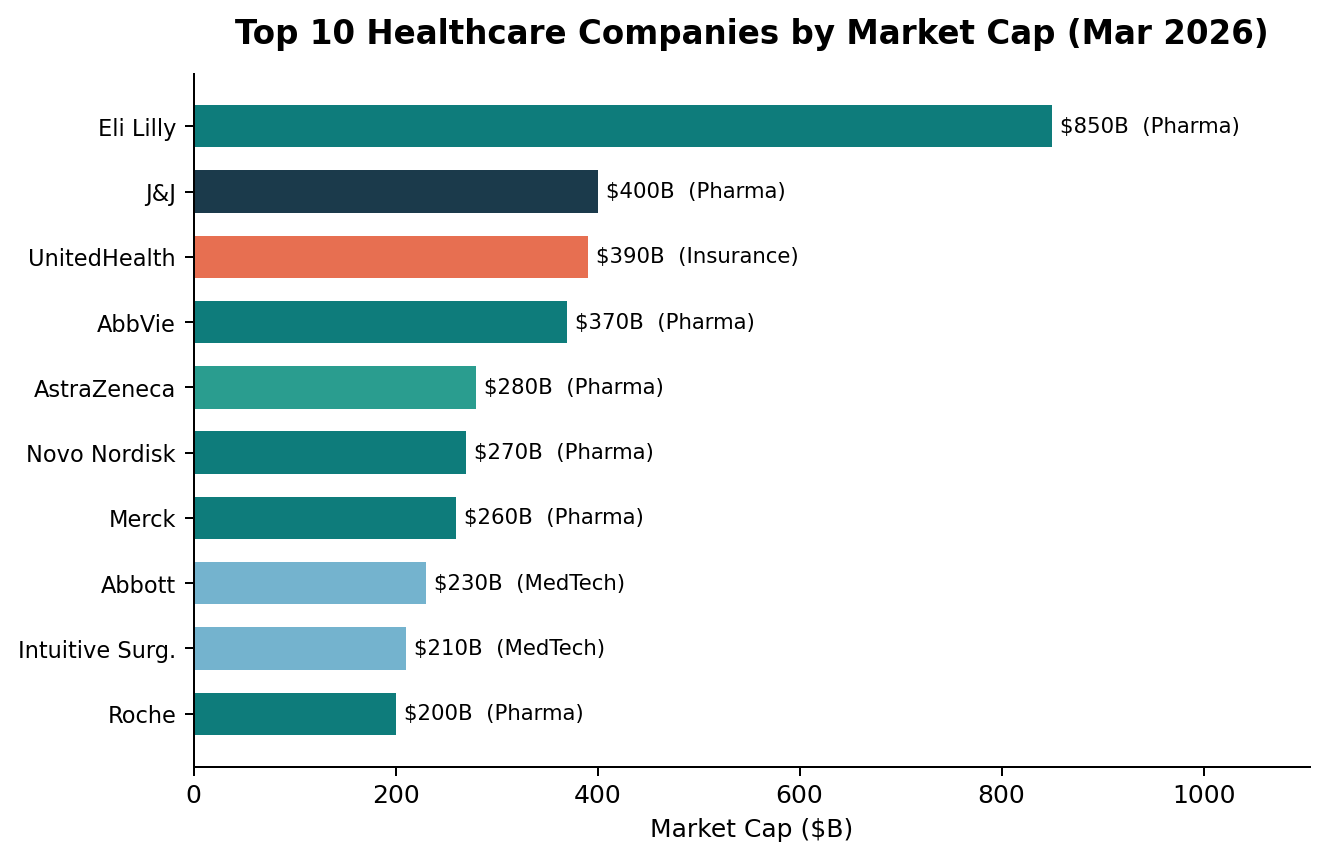
3.1 Top Healthcare Companies by Market Cap & Revenue
| Company | Sub-Sector | Rev ($B) | Rev Gr. | Op. Mgn | Mkt Cap | Fwd P/E | EV/EBITDA | Div Yld |
|---|---|---|---|---|---|---|---|---|
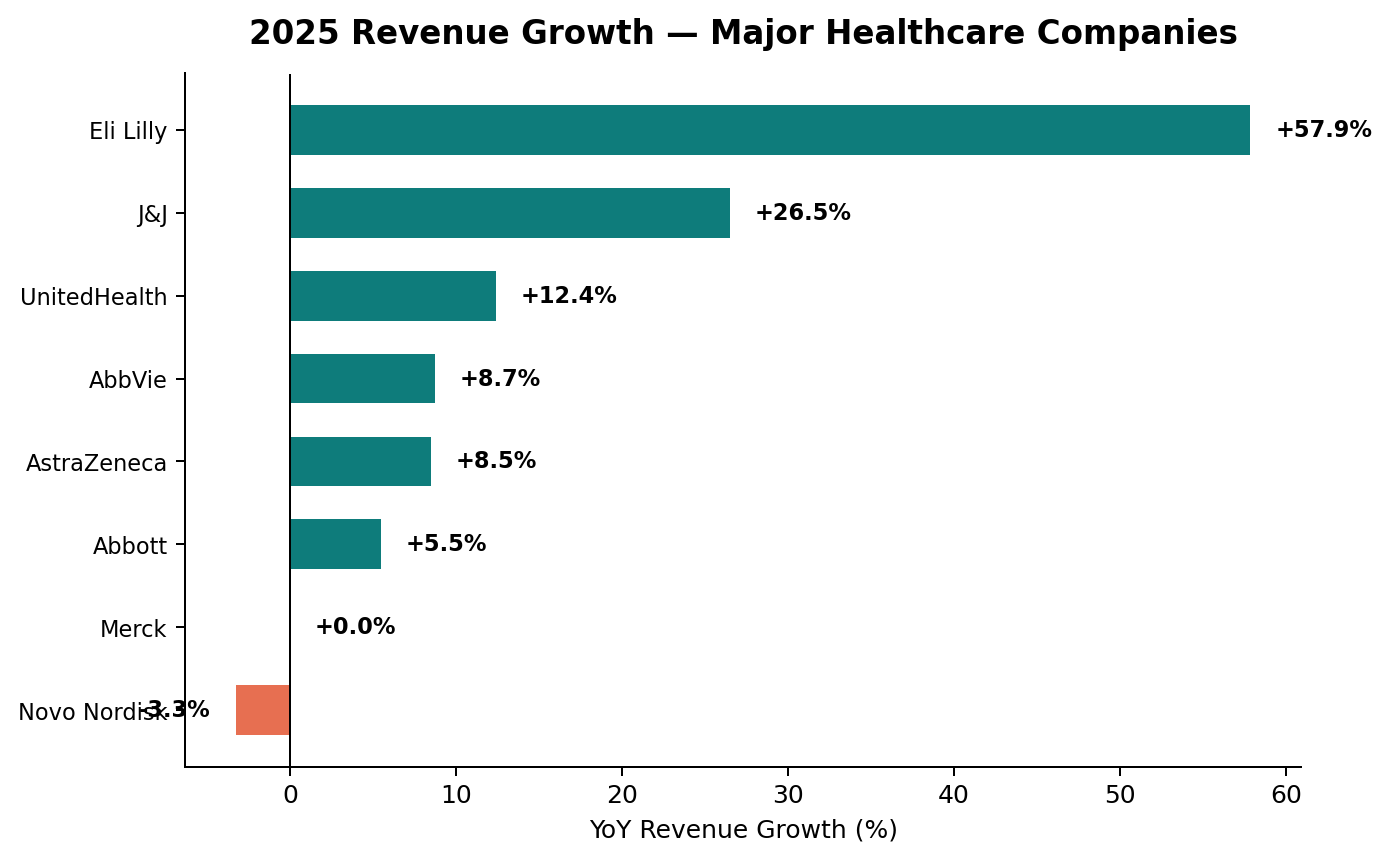
| Eli Lilly | Pharma | $65.2 | +45% | 38% | ~$1.0T | 52x | 42x | 0.6% |
| J&J | Pharma | $89.8 | +27% | 28% | $400B | 15.5x | 13x | 3.2% |
| UnitedHealth | Insurer | $447.6 | +12% | 4.2% | $390B | 16.5x | 13.5x | 1.7% |
| AbbVie | Pharma | $61.2 | +9% | 35% | $370B | 16x | 13.5x | 3.5% |
| AstraZeneca | Pharma | $58.7 | +9% | 25% | $280B | 18x | 15x | 2.1% |
| Novo Nordisk | Pharma | $41.4 | -5–13%E | 42% | $270B | 24x | 18x | 1.4% |
| Merck | Pharma | $64.2 | Flat | 32% | $260B | 12x | 10.5x | 3.0% |
| Abbott | MedTech | $42.3 | +6% | 20% | $230B | 24x | 18x | 1.8% |
| Intuitive Surg. | MedTech | $9.0 | +23% | 30% | $210B | 72x | 55x | 0.0% |
| Roche | Pharma | $58.0 | +4% | 33% | $200B | 14x | 11x | 3.4% |
Source: Company filings (FY2025 where available), LSEG consensus estimates, Bloomberg. Market caps as of mid-March 2026. Forward P/E and EV/EBITDA based on NTM consensus.
3.2 Competitive Dynamics & Strategic Positioning
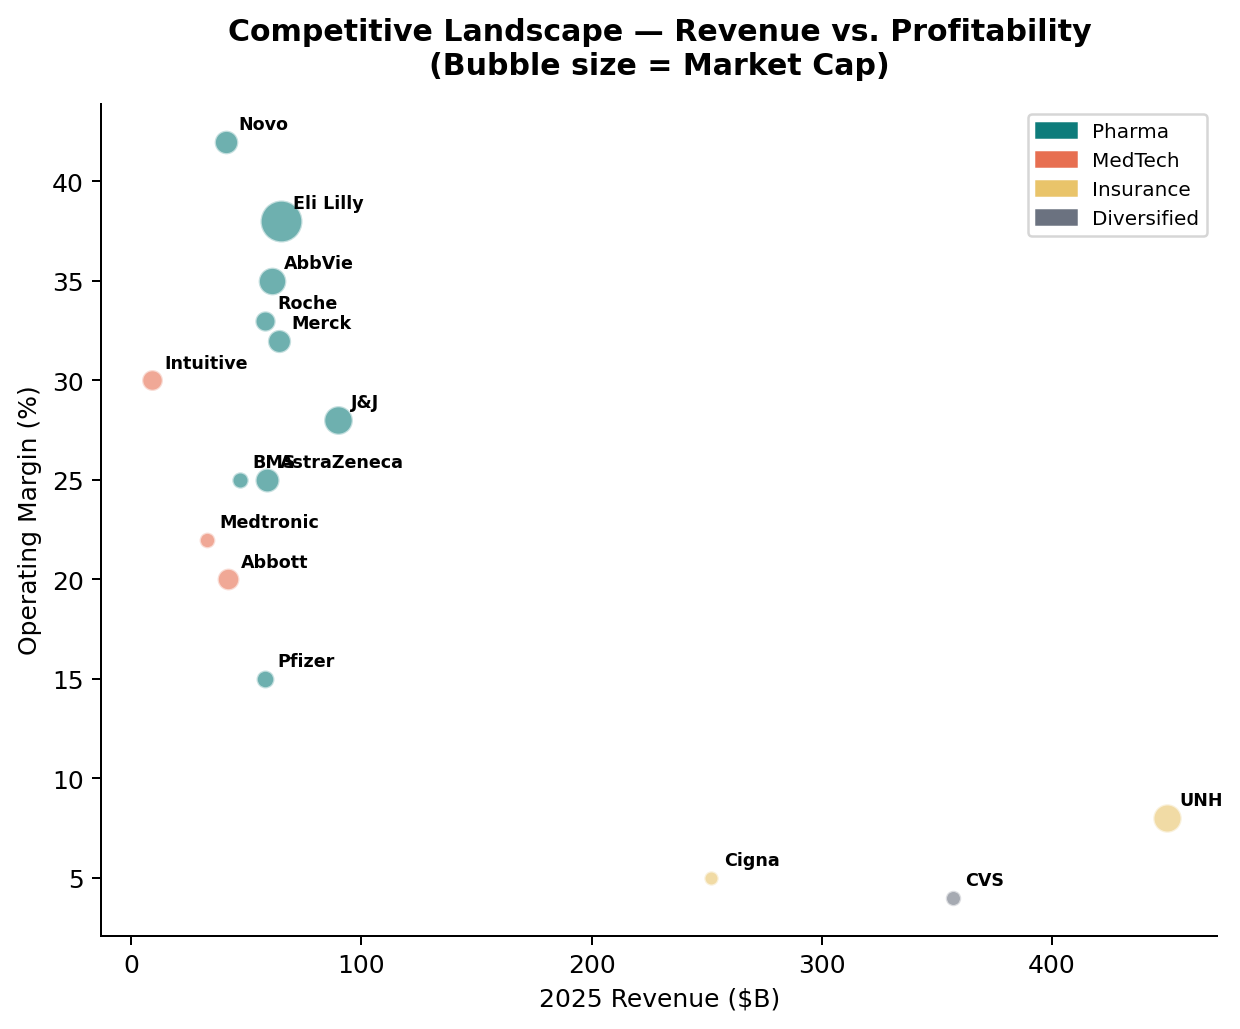
The healthcare competitive landscape is defined by three structural dynamics. First, scale and vertical integration are creating winner-take-more outcomes, particularly in managed care (UnitedHealth/Optum’s care delivery, PBM, and analytics integration) and diversified pharma (J&J’s Innovative Medicine + MedTech dual platform). Second, innovation intensity is the primary valuation differentiator. Eli Lilly commands a ~42x EV/EBITDA, roughly 3x the large pharma median, purely on the strength of its GLP-1 franchise and tirzepatide’s patent durability. Intuitive Surgical trades at 55x on the back of da Vinci’s 80%+ installed base share and razor/blade consumable economics. Third, the patent cliff is forcing an unprecedented portfolio-turnover cycle through M&A, with large pharma deploying record capital to acquire pipeline assets.
3.2.1 Novo Nordisk’s Competitive Headwinds
Despite its first-mover advantage in GLP-1s, Novo faces mounting pressure. Its projected 5–13% revenue decline in 2026 reflects: (1) U.S. pricing compression from the Trump administration deals, (2) patent expirations in China, Brazil, and Canada, (3) Eli Lilly’s superior clinical data in head-to-head tirzepatide vs. semaglutide trials, and (4) an explosive but early-stage oral launch that may cannibalize higher-margin injections. Lilly’s prescription share gains throughout 2025 have been notable, and the gap is expected to widen.
3.2.2 Keytruda Concentration Risk
Merck faces the sector’s most acute single-product concentration risk. Keytruda generated approximately $28 billion in peak revenue, with patent expiry in 2028 and biosimilar entry expected in 2028–2029 (though the OBBBA’s expanded orphan drug exclusion has delayed its selection for IRA price negotiation). Merck has been actively pursuing bolt-on acquisitions to diversify, including the $10 billion Verona Pharma deal (respiratory) and the $9.2 billion Cidara Therapeutics acquisition (antivirals), but replacing $28 billion in annual revenue remains the sector’s most consequential pipeline-refresh challenge.11
3.2.3 Managed Care Margin Recovery
UnitedHealth’s FY2025 results illustrate the managed care profitability cycle: despite record $447.6 billion in revenue, total earnings from operations fell to $19 billion (operating margin compressed to 2.7% from 5.2% in 2024). UnitedHealthcare’s operating margin was effectively cut in half, with earnings dropping 40% year-over-year to $9.4 billion. Key headwinds include elevated medical utilization, lower CMS Medicare Advantage rate increases, tighter risk adjustment, and Medicare Advantage EBITDA margins approaching breakeven (72% of plans operating at negative EBITDA in 2024). McKinsey projects a gradual recovery of 100–150 basis points by 2029, supported by higher CMS rate adjustments, product optimization, and market exits by unprofitable carriers.
4. Valuation Context
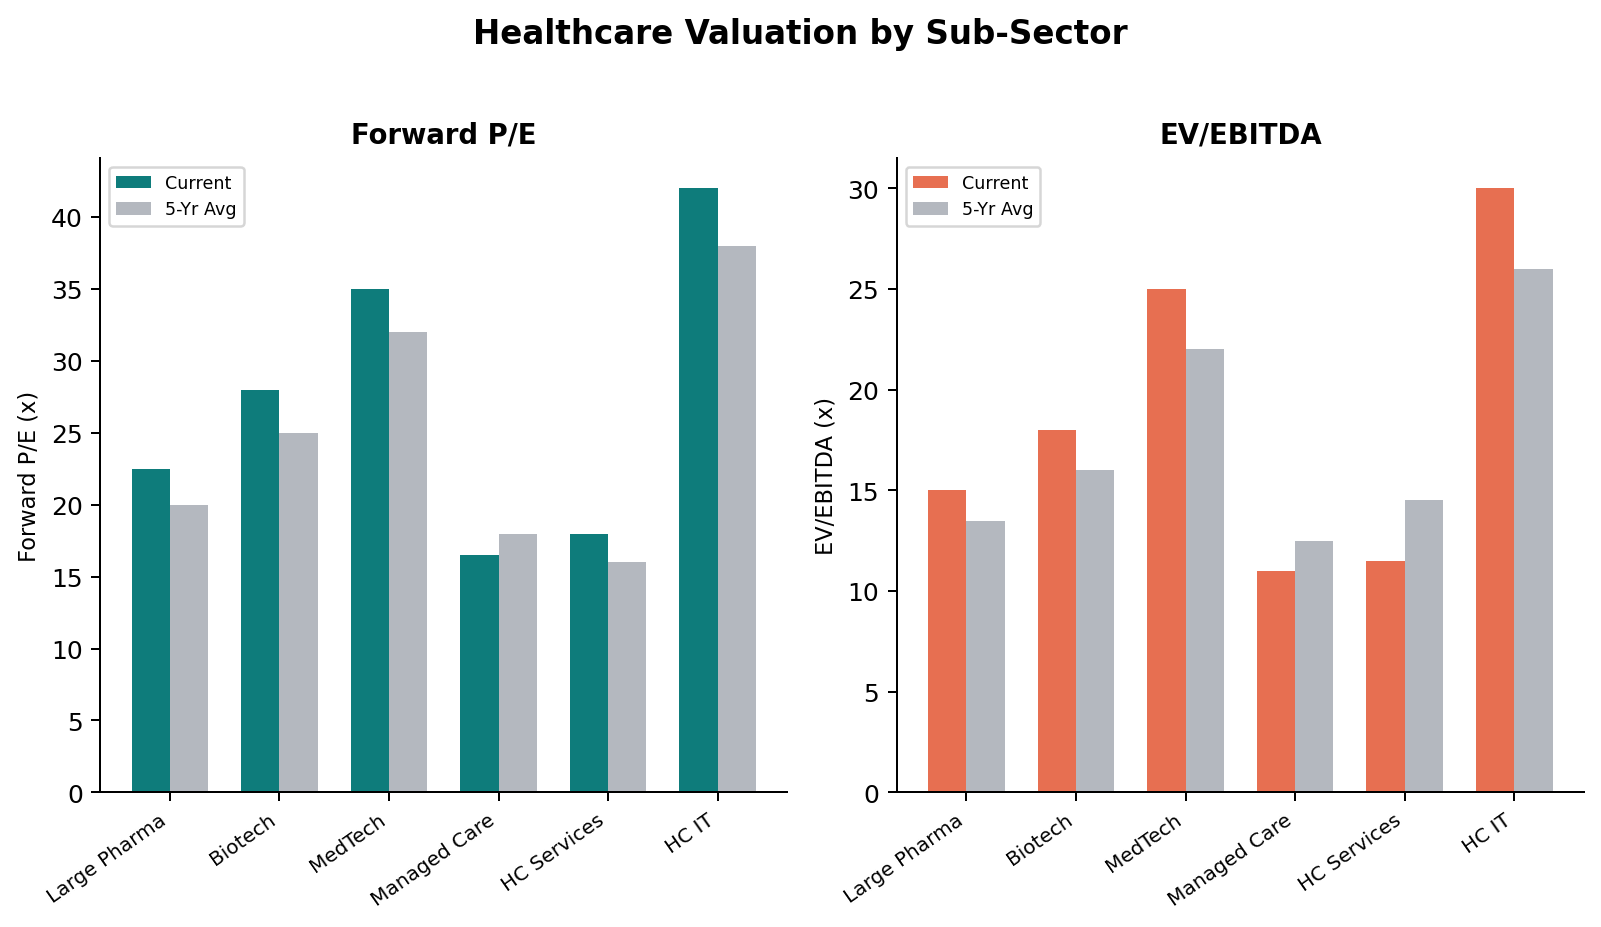
Healthcare valuation multiples vary widely across sub-sectors, reflecting divergent growth and risk profiles. The following framework captures the current valuation hierarchy:
| Sub-Sector | EV/EBITDA Range | Valuation Driver | Notable Outliers |
|---|---|---|---|
| Healthcare IT & High-Growth MedTech | 30–55x | Recurring revenue, switching costs | ISRG (55x), VEEV (45x) |
| Innovation Pharma (GLP-1 Leaders) | 35–45x | Secular growth, patent duration | LLY (42x) |
| Diversified Large Pharma | 10–15x | Pipeline refresh, LOE risk | MRK (10.5x), RHHBY (11x) |
| Managed Care | 11–13x | Margin recovery potential | UNH (13.5x) vs. 5-yr avg 16–18x |
| Healthcare Services | 10–12x | Labor costs, credit conditions | Median ~11.5x (vs. 14.5x prior yr) |
| Biotech (Pre-Revenue) | EV/Pipeline | Platform value, clinical stage | Highly binary outcomes |
4.1 M&A Transaction Activity & Multiples
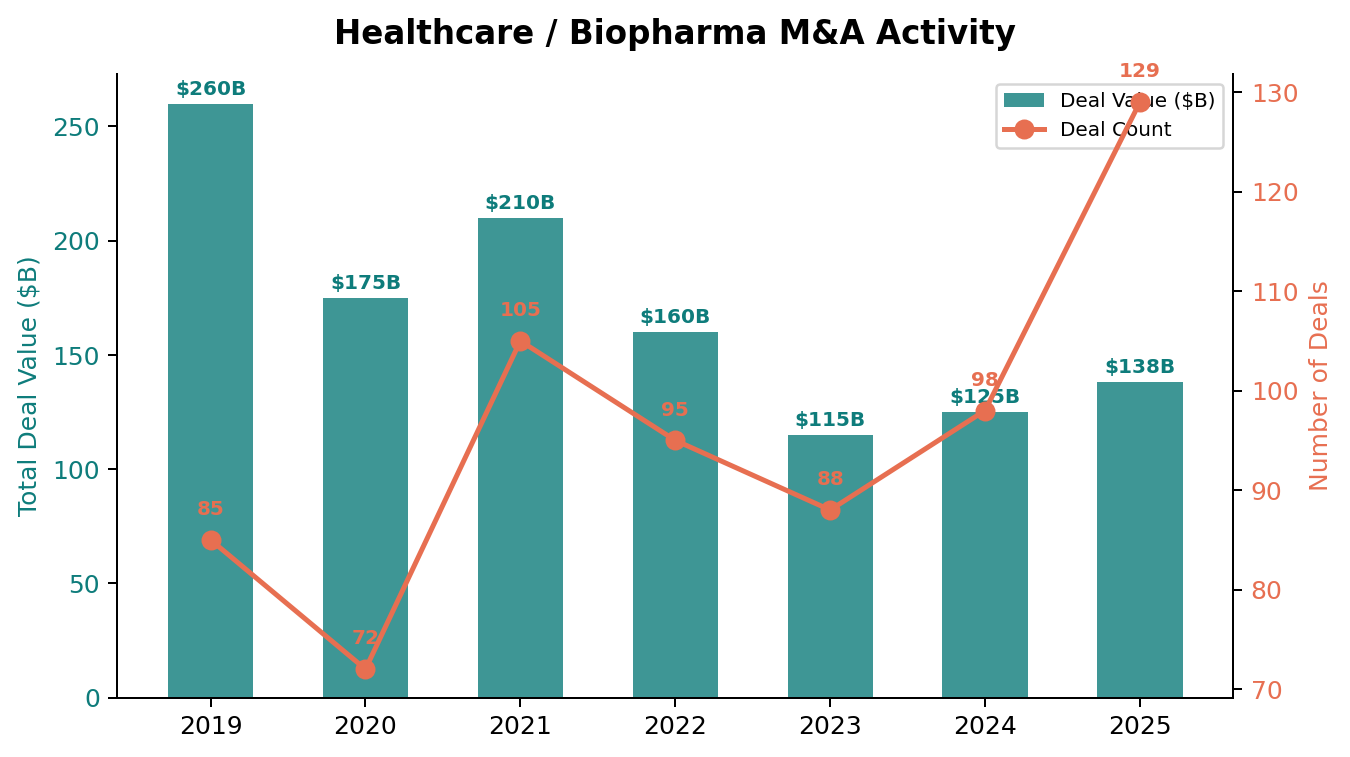
Biopharma M&A surged in 2025 with 129 deals totaling $138 billion, exceeding 2024 volumes. Six of the top 10 deals occurred in Q4, signaling revived dealmaking confidence after a cautious first half marked by FDA leadership turnover, tariff uncertainty, and the most-favored-nation pricing executive order.4
4.1.1 Landmark 2025 Transactions
| Acquirer | Target | Value | Therapeutic Area | Strategic Rationale |
|---|---|---|---|---|
| Abbott | Exact Sciences | $25.7B | Diagnostics | Cologuard platform; dx expansion |
| J&J | Intra-Cellular | $14.6B | CNS/Neuro | Caplyta franchise; anxiety pipeline |
| Novartis | Avidity Bio. | $12.0B | Neuromuscular | AOC RNA-delivery platform |
| Pfizer | Metsera | $10.0B | Obesity | Next-gen GLP-1 pipeline assets |
| Merck | Verona Pharma | $10.0B | Respiratory | Ohtuvayre (COPD); portfolio diversif. |
| Sanofi | Blueprint Med. | $9.5B | Rare Disease | Immunological disease portfolio |
| Merck | Cidara Therap. | $9.2B | Antivirals | CD388 long-acting antiviral |
| Genmab | Merus | $8.0B | Oncology | Petosemtamab; bispecific antibodies |
| Novo Nordisk | Akero Therap. | $5.2B | MASH/Liver | Phase 3 MASH candidate |
| Roche | 89bio | $3.5B | Metabolic | Pegozafermin for steatohepatitis |
4.1.2 2026 M&A Outlook
The 2026 outlook is robust. PwC forecasts that M&A will serve as a catalyst for business model reinvention across biopharma, medtech, health services, and digital health. Cross-border partnerships will become more important, and divestitures will sit alongside acquisitions as companies rebalance portfolios.12 KPMG notes that biopharma companies hold nearly $1.4 trillion in combined cash and debt capacity, providing ample firepower for continued dealmaking. Key target areas include cardiometabolic/obesity, oncology (bispecific antibodies, in vivo CAR-T), immunology, rare disease, and next-gen modalities (genome editing, RNA therapeutics). Asia Pacific deal volumes grew 12% in 2025, driven by a 53% increase in China dealmaking as investors target the country’s innovative drug development landscape.
Private equity healthcare deals averaged 11–13x median EV/EBITDA, while strategic acquirers paid 20–40% premiums. Companies under the most acute M&A pressure include Merck (Keytruda LOE), BMS (Revlimid/Eliquis LOE), and Pfizer (post-COVID pipeline gaps), each of which has significant balance sheet capacity and urgent need to replenish revenue streams.
5. Investment Implications
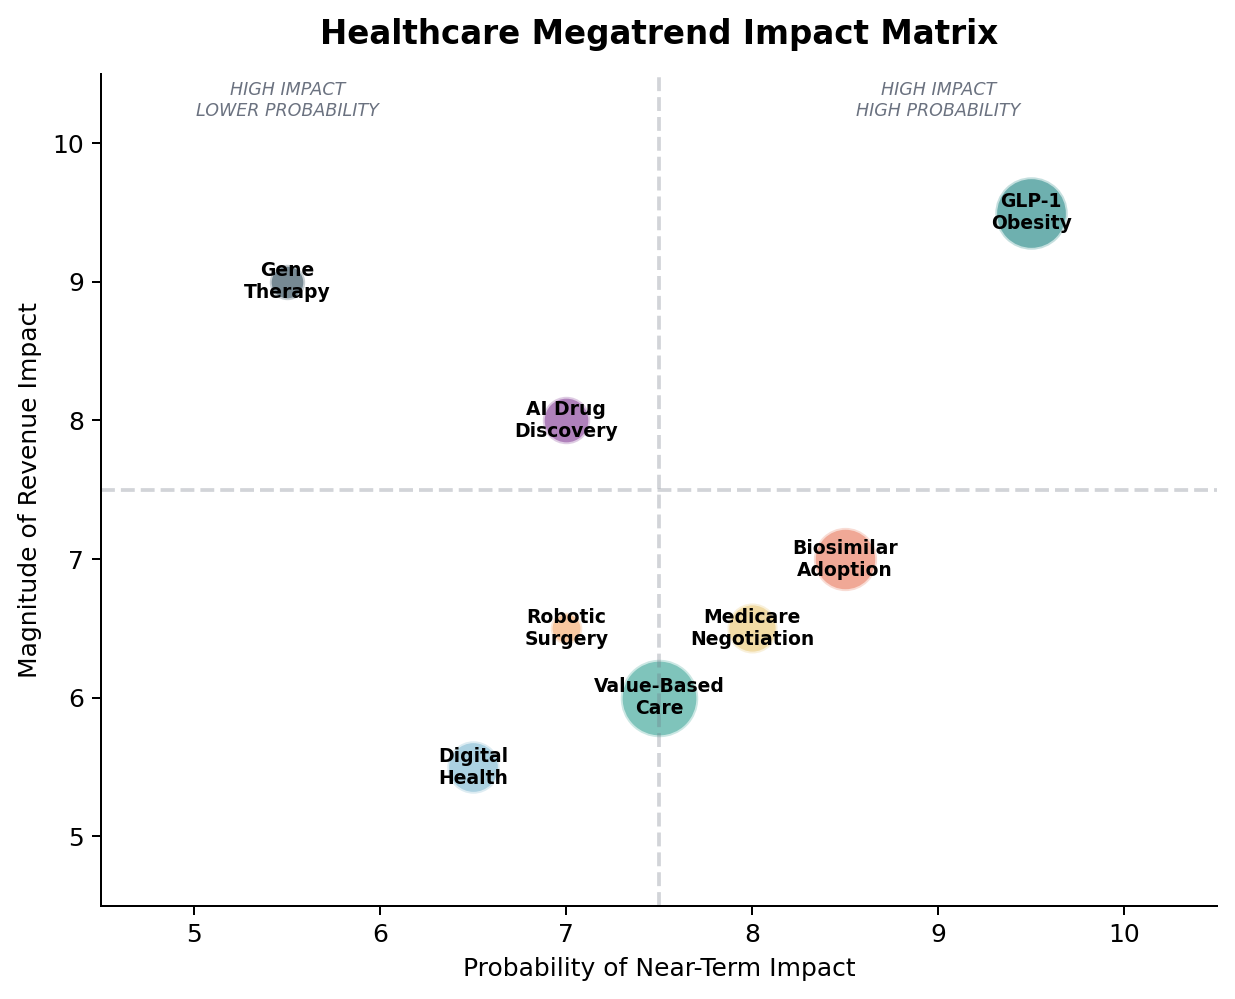
5.1 Thematic Investment Opportunities
5.1.1 GLP-1 Ecosystem
Beyond Eli Lilly and Novo Nordisk, opportunity extends across the GLP-1 value chain: CDMO/fill-finish providers (Catalent/Novo Holdings), auto-injector and pen device manufacturers (Gerresheimer), primary care infrastructure companies that benefit from expanded patient populations, and digital health platforms enabling telehealth-based obesity management and monitoring. The oral GLP-1 segment introduces new opportunities in small-molecule manufacturing and distribution logistics. With 20–25 million patients currently on GLP-1s globally and penetration at only ~2% of the obese population, the addressable patient pool expansion remains in early innings.
5.1.2 AI Infrastructure for Pharma
While AI drug discovery remains pre-revenue for most pure-play names, enabling infrastructure companies offer more de-risked exposure: NVIDIA GPUs powering molecular simulation, cloud platforms for clinical trial analytics, and specialized data companies providing real-world evidence. The healthcare IT market’s 16.7% growth rate through 2034 reflects the sector’s digitization tailwind, with clinical solutions commanding a 70% market share.
5.1.3 Biosimilar Winners
Companies like Sandoz (Novartis spin-off), Teva, and Fresenius Kabi are positioned to capture billions in revenue as $120B+ in branded biologics face patent expiry. The upcoming semaglutide international patent expirations by 2027 represent a particularly large opportunity in emerging markets. Biosimilar-focused CDMOs and raw material suppliers also benefit.
5.1.4 Managed Care Recovery
UnitedHealth, Elevance, and Humana trade at meaningful discounts to historical averages (11–13x EV/EBITDA vs. 5-year average of 16–18x) following the severe 2025 margin compression cycle. McKinsey expects Medicare Advantage margins to recover 100–150 basis points by 2029, driven by higher CMS rate adjustments, payer-led product optimization, and exits of unprofitable carriers. Premium pricing actions and normalization of medical cost trends into 2026–27 could drive significant multiple re-rating, offering contrarian value.
5.1.5 Medtech & Robotic Surgery
Intuitive Surgical’s da Vinci platform dominates robotic surgery with 80%+ installed base share, generating strong recurring revenue from instruments and accessories. However, competition is intensifying from Medtronic Hugo, J&J Ottava, and Stryker’s Mako ecosystem expansion. Abbott’s $25.7 billion acquisition of Exact Sciences signals further M&A-driven consolidation in diagnostics and precision medicine.
5.2 Bull vs. Bear Framework
| Bull Case | Bear Case |
|---|---|
| GLP-1 market exceeds $100B TAM as indications expand (NASH, Alzheimer’s, addiction, sleep apnea, cardiovascular risk) | IRA pricing pressure accelerates and expands to commercial insurance; political pressure intensifies beyond current scope |
| Oral GLP-1s unlock massive new patient pools (~2% obesity penetration today); Medicare coverage begins via BALANCE program | Patent cliff creates multi-year revenue gap; M&A fails to offset $120B+ in expiring revenues |
| AI drug discovery delivers breakthrough compounds, shortening development timelines from 10 to 5 years | Medical utilization stays elevated as post-COVID demand persists; labor costs remain structurally higher |
| Managed care repricing cycle restores margins to historical levels (operating margin recovery to 4–5%+) | ACA subsidy expiration drives 9–10M market exits, worsening risk pools and compressing payer EBITDA by 50–80 bps |
| Record M&A capacity ($1.4T+ cash/debt) fuels pipeline replenishment; lower interest rates improve deal economics | Elevated interest rates compress M&A multiples and raise deal hurdle rates; antitrust enforcement tightens |
| Biosimilar adoption drives total healthcare costs lower, enabling expanded coverage and access | Compounded GLP-1 market persists despite FDA enforcement, undercutting branded pricing power |
5.3 Key Catalysts to Watch
Q1–Q2 2026
- Oral Wegovy launch trajectory and weekly prescription data; Lilly orforglipron FDA decision (expected March–April)
- Medicare negotiated pricing impact on Q1 pharma earnings (first quarter under new IRA prices)
- BALANCE pilot program rollout for Medicare/Medicaid GLP-1 coverage with $50 monthly OOP cap
- ACA subsidy expiration impact on individual market enrollment and payer risk pools
Mid-2026
- Managed care 2027 premium rate filings; CMS 2027 Medicare Advantage rate update
- Phase 3 readouts for next-gen obesity agents: CagriSema (GLP-1/amylin), amycretin (oral and injectable)
- June 1 deadline for CMS to send initial offers for 2028 IRA drug price negotiations
H2 2026
- IRA Round 3 drug selections (15 additional drugs including first Part B inclusions) with prices effective 2028
- Keytruda biosimilar pathway clarity; major pharma pipeline events (Merck, AbbVie late-stage trials)
- TrumpRx direct-to-consumer platform launch; impact on branded drug pricing and volume dynamics
2027+
- Semaglutide international patent expirations; biosimilar/generic GLP-1 entrants in China, India, Brazil
- Potential expansion of Medicare negotiation to commercial market; value-based care tipping point
- Medicare Advantage EBITDA margin recovery trajectory (target ~2% by 2029 per McKinsey)
6. Risk Factors & Structural Headwinds
6.1 Regulatory & Political Risk
The healthcare sector remains highly exposed to regulatory and political risk. The IRA’s drug negotiation program creates direct pricing pressure on selected drugs and accelerated biosimilar adoption signals. Executive Order 14273 (“Lowering Drug Prices by Once Again Putting Americans First”) signals continued bipartisan appetite for drug pricing reform. The OBBBA’s modifications to the IRA, while providing some relief through broadened orphan drug exclusions, also create new complexity around formulary management, especially as the Part D benefit redesign takes effect with a $2,100 annual out-of-pocket threshold (up from $2,000 in 2025). Tariff uncertainty adds another layer: while the Lilly/Novo GLP-1 deals include tariff exemptions, pharmaceutical tariffs more broadly could impact drug costs and supply chains.
6.2 Clinical & Pipeline Risk
The pharmaceutical industry’s historical attrition rate (~90% of Phase 1 compounds fail to reach approval) remains a fundamental risk. AI drug discovery, despite enormous investment, has yet to deliver a transformative approved therapy. The GLP-1 space faces competitive risk from 160+ pipeline agents, with the potential for next-gen mechanisms to leapfrog current standard-of-care. Adverse event data on long-term GLP-1 use (thyroid, pancreatitis, muscle wasting) could negatively impact adoption trajectories. Persistence remains a challenge: data from Prime Therapeutics shows only 1 in 12 members remain on GLP-1 treatment after three years.
6.3 Macroeconomic & Capital Markets Risk
Healthcare sector performance correlates with interest rate expectations (particularly for high-multiple growth assets like Eli Lilly and Intuitive Surgical), credit conditions (impacting leveraged healthcare services and PE-backed assets), and employment trends (driving insurance coverage and utilization). The managed care sector is particularly sensitive to the labor market, with McKinsey estimating that economic growth could create up to five million jobs between 2026 and 2029, each representing potential new insured lives.
6.4 Cybersecurity & Operational Risk
The 2024 Change Healthcare cyberattack, which cost UnitedHealth Group over $1.6 billion (net of taxes) in residual charges through Q4 2025, highlighted the sector’s acute cybersecurity vulnerability. Healthcare systems manage massive quantities of sensitive patient data across interconnected digital platforms, and the accelerating adoption of AI, cloud-based EHRs, and remote monitoring creates expanding attack surfaces. Operational disruptions from cyberattacks can cascade through claims processing, pharmacy networks, and care delivery systems.
Appendix: Sources & Methodology
Market size estimates compiled from: Research and Markets (Healthcare Services Market Report 2025), Statista Market Forecast, IQVIA Institute for Human Data Science, IBISWorld (U.S. Healthcare Industry Analysis), and company filings (10-K/20-F). Revenue and financial data sourced from latest available earnings reports as of March 2026, primarily FY2025 results. Valuation multiples from FOCUS Investment Banking, NYU Stern (Damodaran), and company-specific consensus estimates via LSEG and Bloomberg. M&A data from J.P. Morgan Biopharma & MedTech Deal Reports Q4 2025 and PwC Health Industries M&A Outlook 2026.
Macro and policy analysis informed by: McKinsey & Company (“What to expect in US healthcare in 2026 and beyond,” January 2026), EY Healthcare Sector Outlook 2026 (March 2026), KPMG 2026 Healthcare & Life Sciences Investment Outlook (January 2026), KFF Key Facts About Medicare Drug Price Negotiation (updated March 2026), and CMS program guidance documents. GLP-1 market analysis informed by IQVIA (“Outlook for Obesity in 2026”), Goldman Sachs Research, and CNBC/Fierce Pharma reporting on JPMorgan Healthcare Conference 2026 executive interviews.
Key Sources
- Research and Markets — Healthcare Services Market Report 2025
- FOCUS Investment Banking — Healthcare EBITDA Multiples 2026
- PwC — Global M&A Trends in Health Industries 2026
- IQVIA — Outlook for Obesity in 2026
- J.P. Morgan — Biopharma & MedTech Deal Reports Q4 2025
- Medicare Rights Center — Negotiated Prices for 2026
- KFF — Key Facts About Medicare Drug Price Negotiation (March 2026)
- McKinsey — What to Expect in US Healthcare in 2026 and Beyond
- EY — Healthcare Sector Outlook in 2026
- KPMG — 2026 Healthcare & Life Sciences Investment Outlook
- Eli Lilly — FY2025 Earnings Release (SEC Filing)
- UnitedHealth Group — FY2025 Earnings Release
Disclaimer: This report is for informational purposes only and does not constitute investment advice. All data reflects the most recent publicly available information as of March 2026. Forward-looking estimates are based on consensus analyst projections and are subject to change. The author is not a registered investment advisor, broker, or financial planner.
-
IQVIA Institute for Human Data Science; Research and Markets Healthcare Services Market Report 2025. ↩ ↩2
-
Eli Lilly 2025 10-K (SEC Filing); Lilly FY2025 revenue of $65.2B with Mounjaro+Zepbound combined ~$36.5B. ↩
-
UnitedHealth Group FY2025 earnings release, January 27, 2026: consolidated revenue $447.6B. ↩
-
J.P. Morgan Biopharma & MedTech Deal Reports Q4 2025: 129 M&A deals totaling ~$138B. ↩ ↩2
-
CMS Medicare Drug Price Negotiation Program: negotiated prices for first 10 drugs effective January 1, 2026, achieving 38–79% reductions from 2023 list prices. ↩ ↩2
-
McKinsey & Company, “What to expect in US healthcare in 2026 and beyond,” January 2026. ↩
-
CNBC, “Eli Lilly’s GLP-1 growth is only getting started as Novo Nordisk braces for a decline in 2026,” February 4, 2026. ↩
-
Goldman Sachs analyst estimates; oral GLP-1 segment forecast to capture ~$22B (24%) of global weight-loss drug market by 2030. ↩
-
KFF Key Facts About Medicare Drug Price Negotiation, updated March 2026; 2025 reconciliation law broadened orphan drug exclusion. ↩
-
EY Healthcare Sector Outlook in 2026, March 2026. ↩
-
BioXconomy Top 10 Biotech M&A Deals of 2025; AlphaSense Biotech M&A Outlook for 2026. ↩
-
PwC Global M&A Trends in Health Industries 2026; KPMG 2026 Healthcare & Life Sciences Investment Outlook. ↩