| Global IT Spend (2026E) | Software Spend | Cloud Infra (Q4 Run Rate) | AI Spend (2026E) | Mag 7 S&P Weight | SaaS Fwd P/E |
|---|---|---|---|---|---|
| $6.15T | >$1.4T | $476B | $2.53T | 32.5% | 22.7x |
Table of Contents
- Executive Summary
- Market Overview & Sizing
- 1.1 Global Software Market
- 1.2 Market Segmentation
- 1.3 Industry Structure
- 1.4 Semiconductors
- Key Trends & Drivers
- 2.1 Generative AI: The Defining Catalyst
- 2.2 Hyperscaler AI Capex: $600B+ in 2026
- 2.3 Agentic AI: The Enterprise Inflection
- 2.4 Cloud Computing: Reacceleration to 30%
- 2.5 Cybersecurity: Non-Discretionary & Consolidating
- 2.6 Platform Consolidation & Vertical Integration
- 2.7 Open Source & Developer-Led Growth
- Competitive Landscape
- Valuation Context
- M&A Activity
- Magnificent Seven & Market Structure
- Regulatory Landscape
- 7.1 EU AI Act
- 7.2 DOJ vs. Google
- 7.3 US-China Tech Decoupling
- Investment Implications
- 8.1 Key Thematic Opportunities
- 8.2 Bull vs. Bear Debates
- 8.3 Key Risks
- 8.4 Catalysts to Watch
- Appendix: Sources & Methodology
Executive Summary
The global Technology & Software sector enters Q2 2026 in a striking paradox: record-breaking fundamentals collide with the deepest valuation compression in a decade. Enterprise software spending is on track to exceed $1.4 trillion in 2026 (Gartner, February 2026), hyperscaler AI capex guidance has surged past $600 billion combined for 2026, and cloud infrastructure growth reaccelerated to 30% YoY in Q4 2025, yet the Magnificent Seven are collectively down ~10.5% YTD, SaaS forward P/E multiples have collapsed to 22.7x (below the S&P 500 for the first time ever), and institutional positioning in technology sits at a 17-year low relative to benchmark (Morgan Stanley).
The macro backdrop, geopolitical conflict driving oil prices higher, the Supreme Court’s landmark IEEPA tariff ruling, and investor anxiety over the sheer magnitude of AI infrastructure investment, has triggered a meaningful rotation away from mega-cap tech into energy, value, and international equities. The core question for investors is whether this rotation represents a structural regime change or a temporary dislocation that creates a generational re-entry opportunity.
Key themes shaping the sector:
- AI infrastructure buildout at unprecedented scale: $600B+ hyperscaler capex, NVIDIA at $216B annual revenue, Blackwell GPU demand outpacing supply
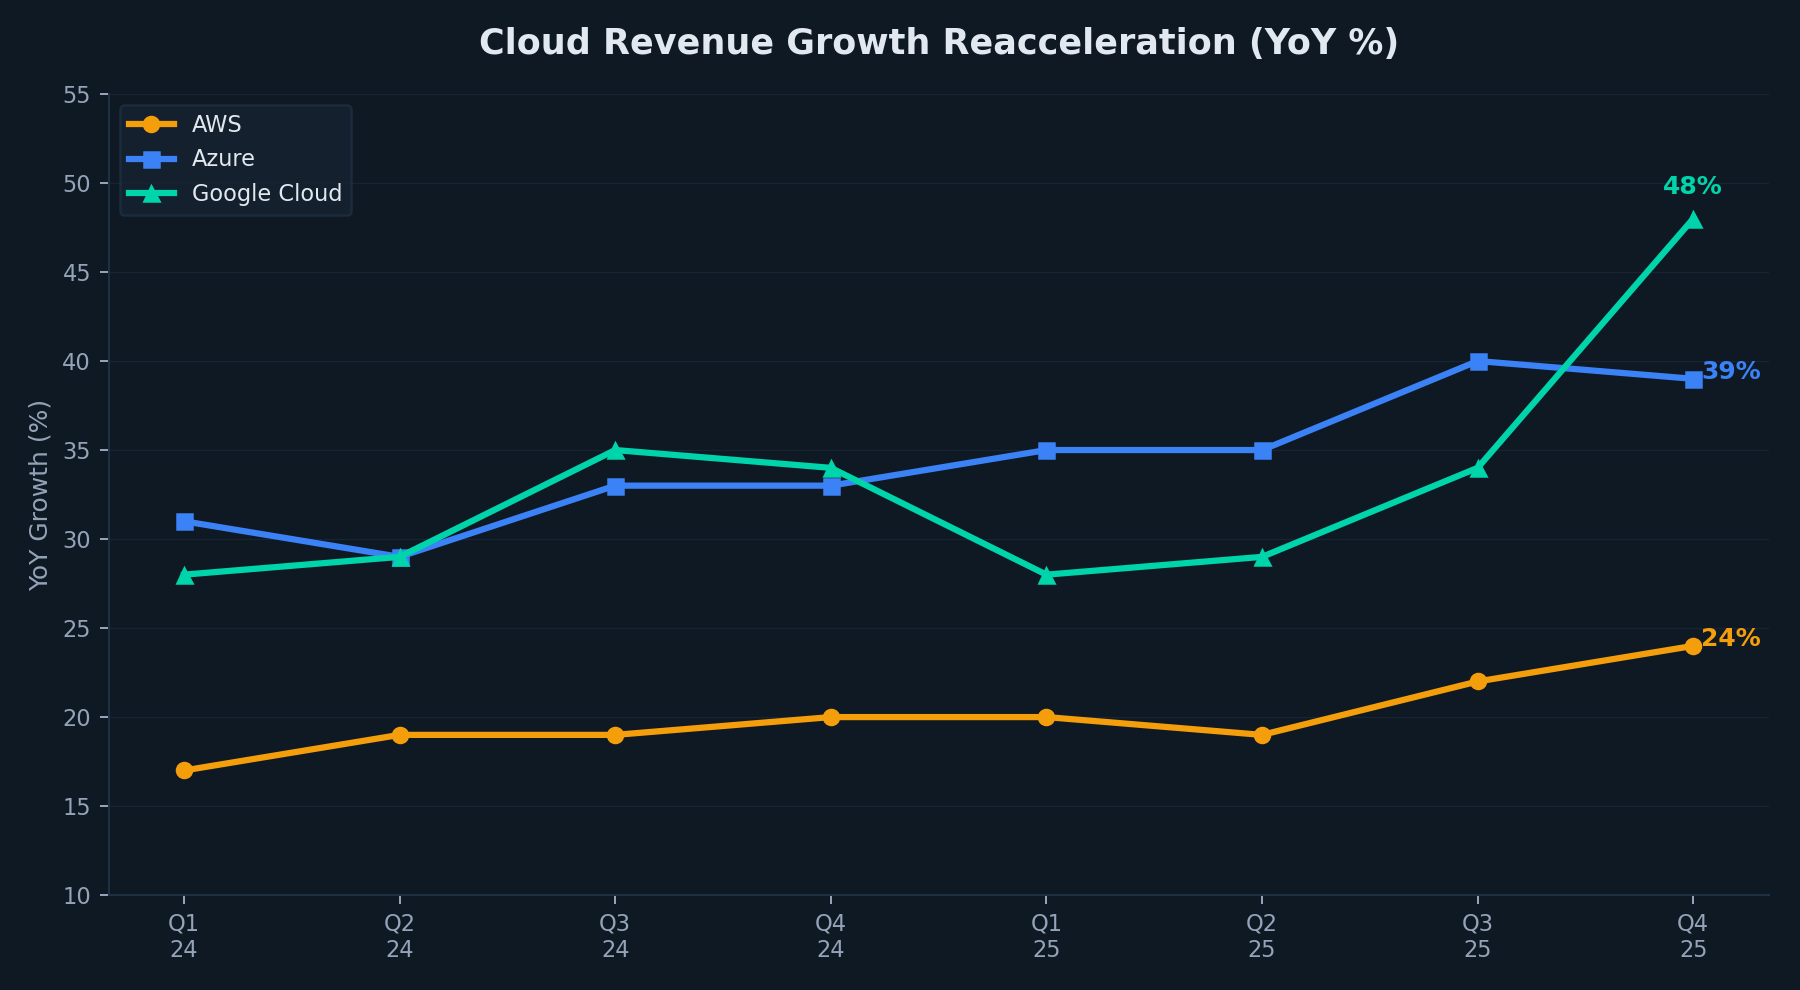
- Cloud reacceleration driven by AI workloads: Google Cloud +48%, AWS +24%, Azure +39% in Q4 2025
- SaaS existential repricing: Median NTM EV/Revenue collapsed to 4.1x (47% below pre-COVID median), driven by AI disruption fears
- Agentic AI emergence: Gartner predicts 40% of enterprise apps will embed AI agents by end of 2026
- Cybersecurity consolidation: $84-96B in M&A deal value, Google/Wiz ($32B) and PANW/CyberArk ($25B) both closed
- Regulatory transformation: EU AI Act high-risk provisions take effect August 2026, DOJ Google remedies under appeal, Supreme Court struck down IEEPA tariffs
1. Market Overview & Sizing
1.1 Global Software Market
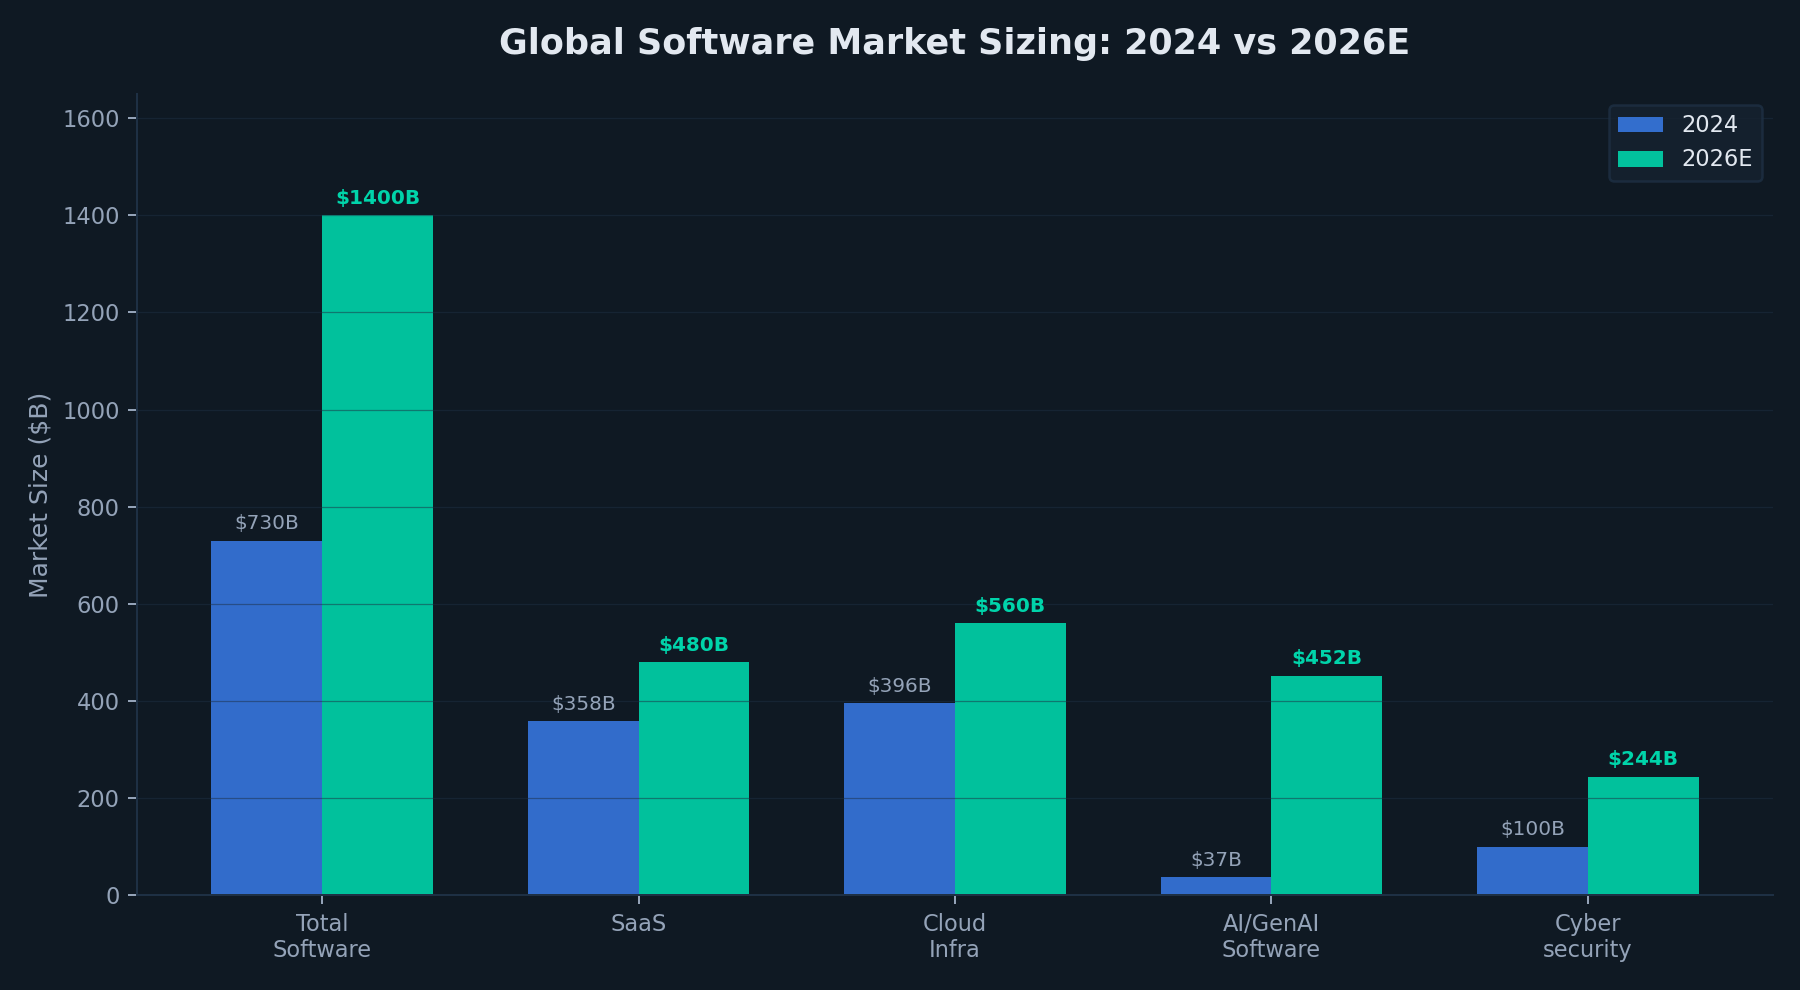
Gartner’s February 2026 IT Spending Forecast projects worldwide enterprise software spending at >$1.4 trillion in 2026, growing 14.7% YoY, following an estimated $1.24 trillion in 2025 (+11.5% YoY). Software remains the largest and second-fastest-growing IT spending category behind data center systems (+31.7%). Total worldwide IT spending is forecast at $6.15 trillion for 2026 (+10.8% YoY), up from $5.55 trillion in 2025.
| Segment | 2024 Est. | 2025 Est. | 2026E | CAGR | Key Driver |
|---|---|---|---|---|---|
| Total Software Market | ~$730B | ~$1.24T | >$1.4T | ~14.7% | AI, cloud, digital transformation |
| SaaS (Public Cloud) | ~$246B | ~$299B | ~$370B | ~21% | Subscription model shift, AI embedding |
| Enterprise Software (Total) | ~$317B | ~$370B | ~$425B+ | ~12% | ERP, CRM, HCM modernization |
| AI / GenAI Software | ~$37B | ~$283B | ~$452B | ~60% | Foundation models, copilots, agents |
| Cloud Infrastructure (IaaS/PaaS) | ~$330B | ~$419B | ~$560B+ | ~30% | Hyperscaler capex, AI workloads |
| Cybersecurity | ~$187B | ~$213B | ~$244B | ~15% | Threat complexity, regulatory mandates |
| AI Total (All Categories) | N/A | ~$1.76T | ~$2.53T | ~44% | Infrastructure + software + services |
Sources: Gartner IT Spending Forecast (Feb 2026), Gartner AI Spending Forecast (Jan 2026), Synergy Research Group, Grand View Research, MarketsandMarkets, Precedence Research.
1.2 Market Segmentation
By Delivery Model: SaaS accounts for an estimated 49% of enterprise software spend and expanding. SaaS now includes horizontal platforms (Microsoft 365, Salesforce) and increasingly, vertical SaaS purpose-built for specific industries. On-premises software continues to decline but remains significant in regulated sectors.
By Function: ERP represents the largest single software category (~26%), followed by CRM (~20%), HCM (~12%), BI/analytics (~11%), and security (~13%). AI-related tooling is the fastest growing, presently fragmented across these categories but consolidating into platform plays.
By Geography: North America dominates with ~41% of global software revenue (~$379 billion from the US alone in 2025). Europe accounts for ~27%. Asia-Pacific is the fastest-growing at ~12.8% CAGR, driven by cloud adoption in China, India, Japan, and Southeast Asia.
1.3 Industry Structure
The technology and software industry exhibits a dual structure: highly concentrated at the platform layer (hyperscalers and mega-cap software companies controlling critical infrastructure) but fragmented at the application layer (thousands of specialized vendors). Value increasingly accrues at the platform layer where network effects, data moats, and switching costs compound.
The AI value chain spans silicon (NVIDIA, Broadcom, AMD) through infrastructure (AWS, Azure, GCP, colocation) to model providers (OpenAI, Anthropic, Google DeepMind, Meta AI) to application software and enterprise workflows. AI is disrupting the traditional value chain by enabling new entry points: foundation model providers now compete with and complement traditional software vendors at the application layer.
Barriers to entry vary significantly by layer. Platform-layer software (operating systems, databases, cloud infrastructure) has extremely high barriers due to capital intensity ($600B+ hyperscaler capex in 2026 alone), technical complexity, and incumbent network effects. Application software has lower technical barriers but faces distribution challenges and long enterprise sales cycles.
1.4 Semiconductors
The semiconductor sub-sector has undergone a structural re-rating driven by AI compute demand. NVIDIA dominates with an estimated 80%+ share in data center AI training workloads. Custom silicon from Broadcom (five confirmed XPU customers including Google, Meta, Anthropic, OpenAI) and Marvell Technology is gaining traction. AMD remains the primary GPU alternative, while Intel continues its foundry transformation under CEO Lip-Bu Tan.
Key structural dynamics include AI compute demand outpacing supply (Blackwell GPU lead times extending 6+ months), TSMC maintaining process leadership at 3nm/2nm nodes with 92% of advanced AI chip manufacturing, geopolitical risk from Taiwan Strait tensions and evolving US-China export controls, and HBM memory transitioning from SK Hynix and Samsung for AI workloads.
2. Key Trends & Drivers
2.1 Generative AI: The Defining Catalyst
Generative AI represents the most significant software disruption since the shift to cloud computing. Gartner’s January 2026 forecast sizes total worldwide AI spending at $2.53 trillion for 2026 (+44% YoY from $1.76T in 2025). The AI software layer specifically: $283 billion in 2025 rising to $452 billion in 2026 (~60% growth). GenAI model spending alone reached $14.4 billion in 2025 and is projected to grow 80.8% in 2026.
The AI model landscape has accelerated rapidly in early 2026. OpenAI released GPT-5.4 (March 5, 2026) with a 1-million-token context window and native computer-use capabilities. Anthropic shipped Claude 4.6 (February 2026), scoring 80.8% on SWE-Bench Verified. Google launched Gemini 3.1 Pro (tied #1 on Artificial Analysis Intelligence Index). Meta released Llama 4 as open-weight models, with the Scout variant offering an unprecedented 10-million-token context window.
A key structural shift is underway in enterprise AI procurement: in 2024, 47% of AI solutions were built internally vs. 53% purchased externally. By 2025, 76% of enterprise AI use cases are purchased rather than built, representing a massive tailwind for AI-native software vendors.
2.2 Hyperscaler AI Capex: $600B+ in 2026
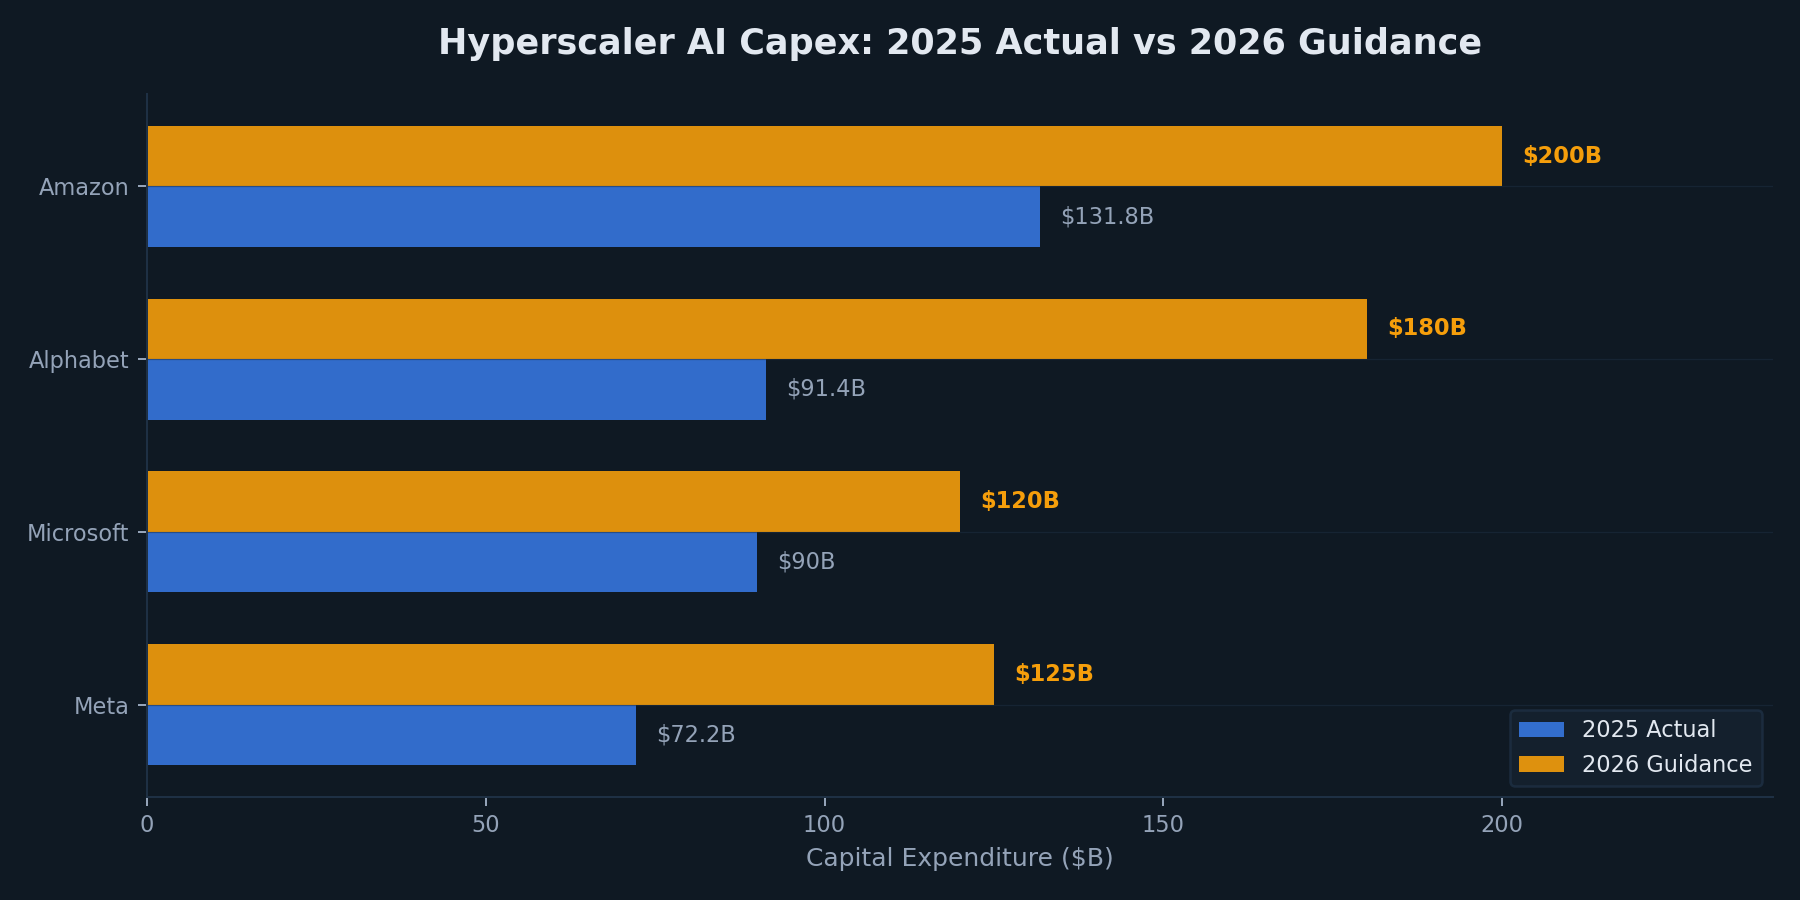
The AI infrastructure buildout represents the most significant capital expenditure cycle in technology history. Combined hyperscaler capex guidance for 2026 exceeds $610-640 billion, up ~60% from ~$385-390 billion in actual 2025 spending.
| Company | 2025 Actual Capex | 2026 Guidance | YoY Change | Key Detail |
|---|---|---|---|---|
| Amazon | $131.8B | ~$200B | +52% | Backlog $244B (+40% YoY) |
| Alphabet/Google | $91.4B | $175-185B | ~+100% | GCP backlog $240B (>2x YoY) |
| Meta | $72.2B | $115-135B | ~+73% | 7.7 GW nuclear power commitments |
| Microsoft | ~$90B (FY25E) | $120B+ | ~+33% | RPO $625B (+110% YoY) |
| Combined | ~$385-390B | ~$610-640B | ~+60% | 75% tied to AI infrastructure |
Goldman Sachs projects total hyperscaler capex for 2025-2027 at $1.15 trillion, more than double the $477 billion spent 2022-2024. Approximately 75% of 2026 capex (~$450 billion) is tied directly to AI infrastructure.
2.3 Agentic AI: The Enterprise Inflection
Agentic AI, software agents that can autonomously execute multi-step tasks, plan, and make decisions, has emerged as the defining enterprise trend of 2026. Gartner predicts 40% of enterprise applications will embed task-specific AI agents by end of 2026, up from <5% in 2025.
Key developments: Microsoft reports 400,000+ custom agents built via Copilot Studio. Salesforce’s Agentforce platform reached $800 million ARR (+169% YoY) with 29,000+ cumulative deals. ServiceNow’s AI NOW platform is driving accelerating enterprise workflow automation. The shift from AI copilots (human-in-the-loop) to AI agents (autonomous execution) has profound implications for SaaS pricing models, with per-seat licensing giving way to consumption-based and outcome-based pricing.
2.4 Cloud Computing: Reacceleration to 30%
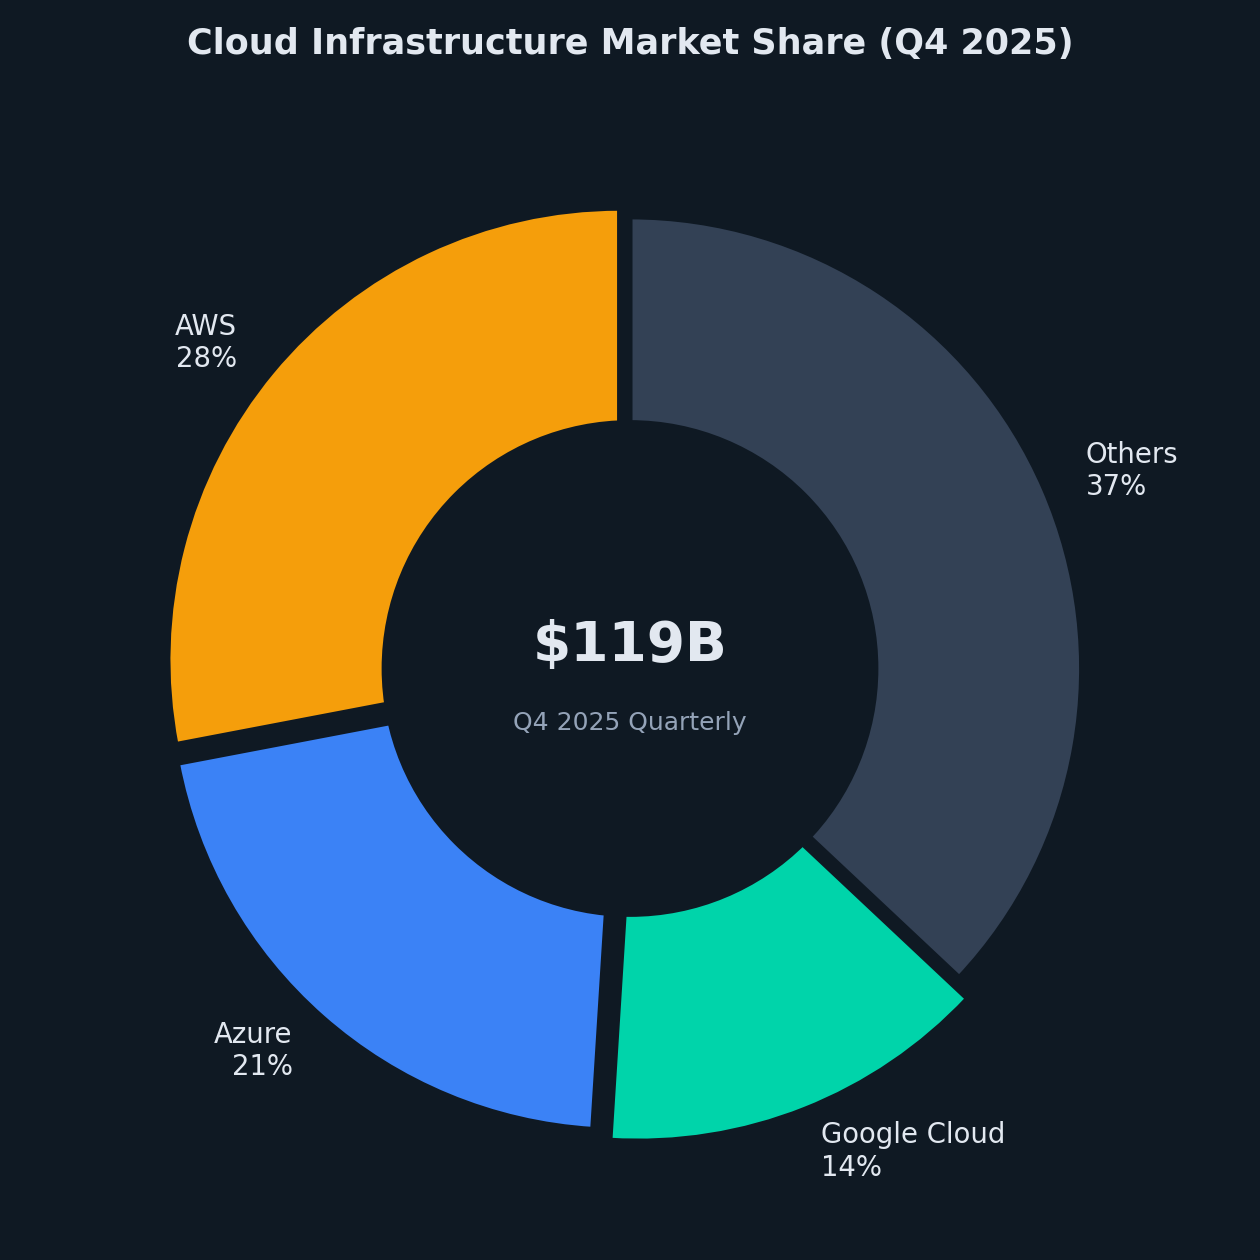
Q4 2025 marked the ninth consecutive quarter of accelerating cloud growth, with the overall market hitting 30% YoY growth, the fastest since early 2022 when the market was less than half its current size. Quarterly cloud infrastructure revenues reached $119.1 billion in Q4, a jump of nearly $12 billion quarter-over-quarter that Synergy Research described as “far surpassing anything previously seen.”
| Provider | Q4 2025 Revenue | YoY Growth | Market Share | Key Highlight |
|---|---|---|---|---|
| AWS | $35.6B | +24% | 28% | Fastest growth in 13 quarters; Trainium >$10B ARR |
| Azure | ~$24-26B (est.) | +39% | 21% | AI revenue run rate ~$25B by June 2026 |
| Google Cloud | $17.7B | +48% | 14% | Operating income +154% YoY; margins 30.1% |
| Others | ~$41B | ~20% | 37% | Oracle OCI +84%, Alibaba recovering |
AI-specific cloud revenue is becoming material. AWS custom chips (Trainium + Graviton) exceeded $10 billion ARR with triple-digit growth. Amazon Bedrock reached multi-billion-dollar ARR with 100,000+ customers. Microsoft is targeting $25 billion in AI revenue by end of FY2026. GenAI-specific cloud services grew 140-180% YoY and have been responsible for at least half of total cloud revenue growth since ChatGPT’s launch.
2.5 Cybersecurity: Non-Discretionary & Consolidating
The global cybersecurity market reached an estimated $213 billion in 2025 (Gartner), growing 15.1% YoY, and is forecast at $244 billion for 2026 (+13.3%). M&A activity was extraordinary: 426 deals announced in 2025 with disclosed value exceeding $84-96 billion, a roughly 270% increase in deal value year-over-year.
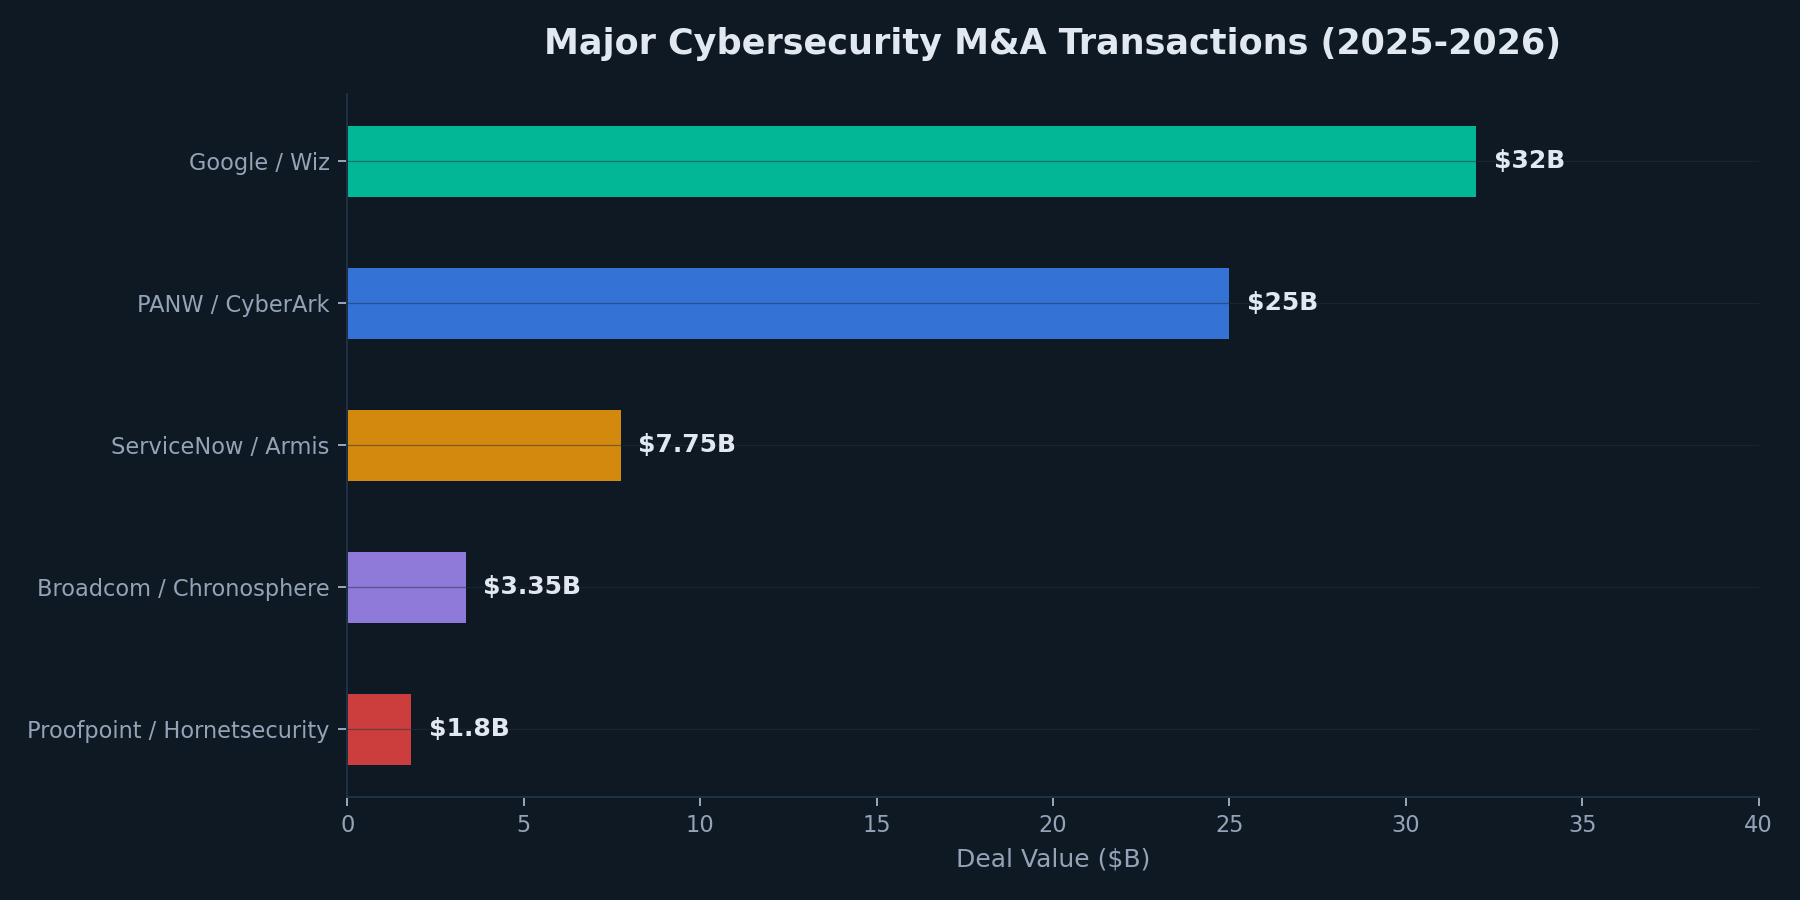
The two landmark deals both closed: Google/Wiz ($32 billion, closed March 11, 2026 after clearing DOJ and EU review) and Palo Alto Networks/CyberArk ($25 billion, closed February 2026). Other major deals included ServiceNow/Armis ($7.75 billion, pending), Palo Alto/Chronosphere ($3.35 billion), and Proofpoint/Hornetsecurity ($1.8 billion).
AI is reshaping cybersecurity both offensively (enabling more sophisticated attacks) and defensively (enabling real-time threat detection, autonomous response). CrowdStrike crossed $5.25 billion ending ARR (+24% YoY), Palo Alto Networks’ NGS ARR reached $6.3 billion (+33% YoY), and Zscaler’s ARR hit $3.36 billion (+25% YoY).
2.6 Platform Consolidation & Vertical Integration
Enterprise customers are actively reducing vendor count, a trend accelerated by economic pressures in 2022-2023 that has structurally altered procurement behavior. CISOs and CIOs increasingly favor comprehensive platforms over best-of-breed point solutions. This favors large-cap platform companies (Microsoft, Salesforce, ServiceNow, SAP) at the expense of smaller point-solution vendors.
Vertical SaaS, software purpose-built for specific industries, represents a counter-trend. Vertical SaaS companies face smaller TAMs but benefit from deeper product-market fit, lower churn, and higher pricing power. Many achieve durable 20-35% growth rates. Large-cap platforms (Meta, Alphabet, Amazon) continue to benefit from digital advertising growth and AI-driven ad targeting improvements. Regulatory risk from antitrust actions represents the primary overhang.
2.7 Open Source & Developer-Led Growth
Open source continues to reshape the software value chain. The rise of foundation models (largely open-source or open-weight: Meta’s Llama 4, Mistral, DeepSeek) is disrupting the AI stack, compressing the cost of AI capabilities and enabling application-layer companies to embed AI without licensing from closed-source providers. Developer-led growth (bottom-up adoption to enterprise expansion) remains a proven GTM motion: GitHub, Snowflake, and Datadog all scaled to multi-billion revenue this way.
3. Competitive Landscape
3.1 Major Players Snapshot
| Company | Revenue (Latest FY) | Rev. Growth | Op. Margin | Key Segment | Primary Moat |
|---|---|---|---|---|---|
| Microsoft (MSFT) | ~$282B (FY25E) | +15% | ~45% | Cloud, AI, Office | Ecosystem lock-in; Azure + M365 + Copilot |
| Alphabet (GOOGL) | $403.9B | +15% | ~32% | Search, Cloud, AI | Search dominance; GCP + Gemini AI |
| Amazon (AWS) | $108B+ (AWS) | +24% | ~35% | Cloud IaaS/PaaS | Scale, breadth, data center footprint |
| NVIDIA (NVDA) | $215.9B | +65% | ~62% | AI GPUs, Data Center | 80%+ AI training share; Blackwell demand |
| Salesforce (CRM) | $40.0B (FY26) | +10% | ~33% | CRM, AI Agents | 21.7% CRM share; Agentforce platform |
| Oracle (ORCL) | ~$60B+ | +14% | ~43% | Cloud ERP, OCI | Mission-critical ERP; OCI AI momentum |
| ServiceNow (NOW) | $12.2B | +22% | ~29% | IT/Ops Workflow | Workflow platform; AI NOW expanding |
| SAP (SAP) | ~$38B | +10% | ~30% | ERP, Cloud | Deep ERP install base; S/4HANA transition |
3.2 Semiconductor Landscape: Q4 2025 Earnings
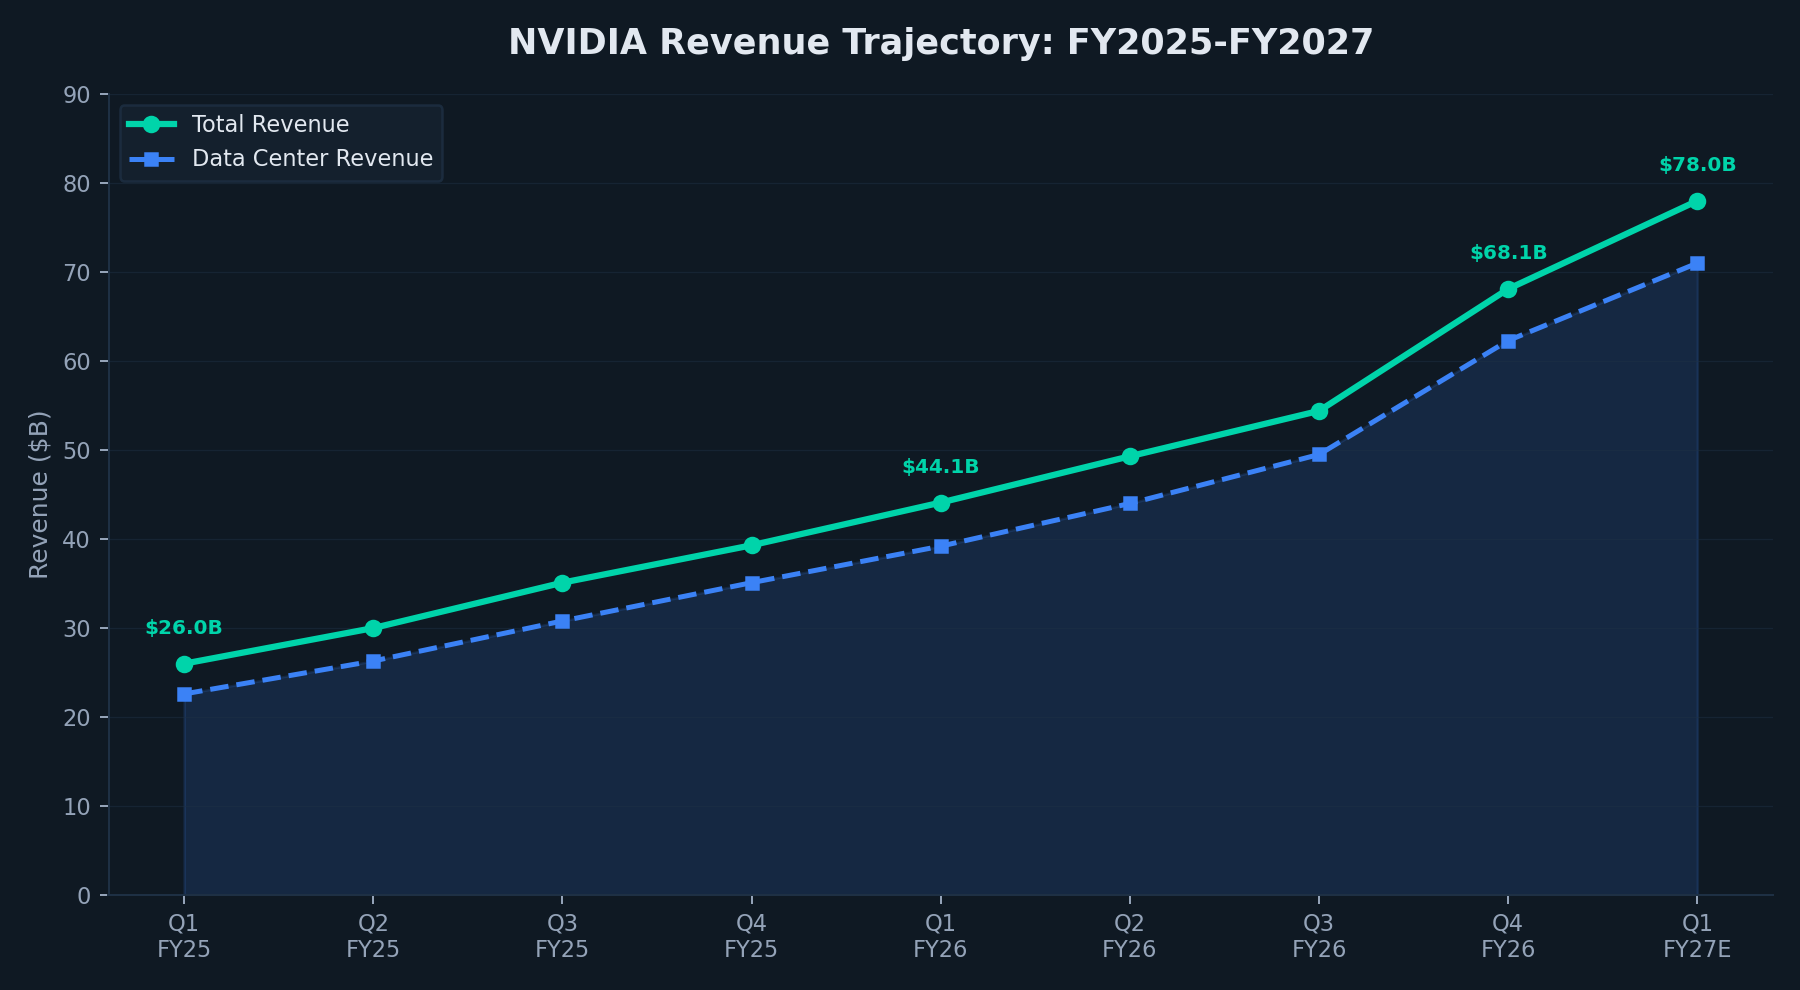
NVIDIA reported Q4 FY2026 revenue of $68.1 billion (+73% YoY), with data center at $62.3 billion (+75%). Full-year FY2026: $215.9 billion (+65% YoY), net income ~$120 billion. Q1 FY2027 guidance of $78 billion (±2%) crushed consensus of $72.6B. Networking revenue surged 263% YoY to $11 billion. Supply commitments nearly doubled to $95.2 billion.
AMD posted Q4 2025 revenue of $10.3 billion (+34%), with data center at $5.4 billion (+39%). Full-year data center: $16.6 billion. Secured landmark OpenAI partnership for Instinct GPUs.
Broadcom delivered AI semiconductor revenue of $8.4 billion in Q1 FY2026 (+106% YoY), with five major XPU customers (Google, Meta, Anthropic, OpenAI). AI backlog: $73 billion. Q2 guidance of $22 billion (+47%) beat consensus.
TSMC reported Q4 revenue of $33.7 billion (+25.5%), full-year $122.4 billion (+35.9%). Advanced nodes (7nm and below) represent 77% of wafer revenue. AI accelerator revenue projected at mid-to-high 50% CAGR through 2029.
Intel under CEO Lip-Bu Tan: Q4 revenue $13.7 billion (-4%), GAAP net loss of $591 million. Intel Foundry full-year operating loss widened to -$10.3 billion. 18A process shipped first chips but yields remain below targets. Strategic investments from NVIDIA ($5B), SoftBank ($2B), and the U.S. government (~10% equity from CHIPS Act) provide capital lifelines. Foundry breakeven slipped to late 2027/early 2028.
3.3 Big Tech Q4 2025 Earnings
All five mega-cap technology companies exceeded revenue consensus in Q4 2025:
| Company | Q4 Revenue | YoY Growth | Net Income | Key Highlight |
|---|---|---|---|---|
| Apple (Q1 FY26) | $143.8B | +16% | $42.1B | iPhone +23%, record EPS $2.84 |
| Alphabet | $113.8B | +18% | $34.5B | Google Cloud +48%, YouTube >$60B annual |
| Amazon | $213.4B | +14% | $21.2B | AWS +24%, Advertising +23% |
| Microsoft (Q2 FY26) | $81.3B | +17% | $38.5B* | Azure +39%, Cloud >$50B |
| Meta | $59.9B | +24% | $22.8B | 3.58B DAP, Reality Labs -$19.2B FY |
* Microsoft GAAP net income includes $7.6B net gains from OpenAI investments.
3.4 Enterprise Software: Latest Results
Salesforce reported Q4 FY2026 revenue of $11.2 billion (+12% YoY), with Agentforce ARR reaching $800 million (+169% YoY) and 29,000+ cumulative deals. Full-year FY2026 revenue: $40.0 billion (+10%), with non-GAAP operating margin expanding to 33.4%.
ServiceNow grew Q4 subscription revenue 21% YoY to $3.47 billion, with cRPO growth of 25% beating guidance by 200 basis points. Full-year revenue: $12.2 billion. The company secured strategic partnerships with Google, Anthropic, and NVIDIA.
Oracle’s cloud infrastructure revenue surged 84% YoY to $4.9 billion in Q3 FY2026, with RPO ballooning to $553 billion (+325% YoY). Total Q3 revenue: $17.2 billion (+12%).
Adobe posted Q1 FY2026 revenue of $6.4 billion (+12% YoY) with AI-first ARR more than tripling year-over-year, though CEO Shantanu Narayen’s announced departure weighed on sentiment.
3.5 Competitive Dynamics & Share Shifts
Microsoft has cemented its position as the dominant enterprise platform. The Azure + M365 + GitHub + Copilot ecosystem creates unmatched surface area. Azure’s 39% growth reflects AI-driven demand, though modest deceleration from 40% raised questions. Microsoft is tracking toward $25 billion in AI revenue by June 2026, with Copilot seat attachment accelerating.
Google Cloud’s 48% Q4 growth was the standout result, dramatically accelerating from 34% in Q3. Operating margins expanded to 30.1%, validating the profitability thesis. The $32B Wiz acquisition adds cloud security, the fastest-growing sub-segment.
AWS maintains infrastructure leadership by share (28%) but faces growing competitive pressure from Azure and Google on AI workloads. AWS’s custom chip strategy (Trainium, Graviton) is gaining traction with $10B+ ARR.
Salesforce’s Agentforce pivot is the key strategic bet: at $800M ARR growing 169%, it represents potential re-acceleration of the overall growth profile, but the $40B revenue base makes moving the needle challenging.
4. Valuation Context
4.1 The Historic SaaS Valuation Compression
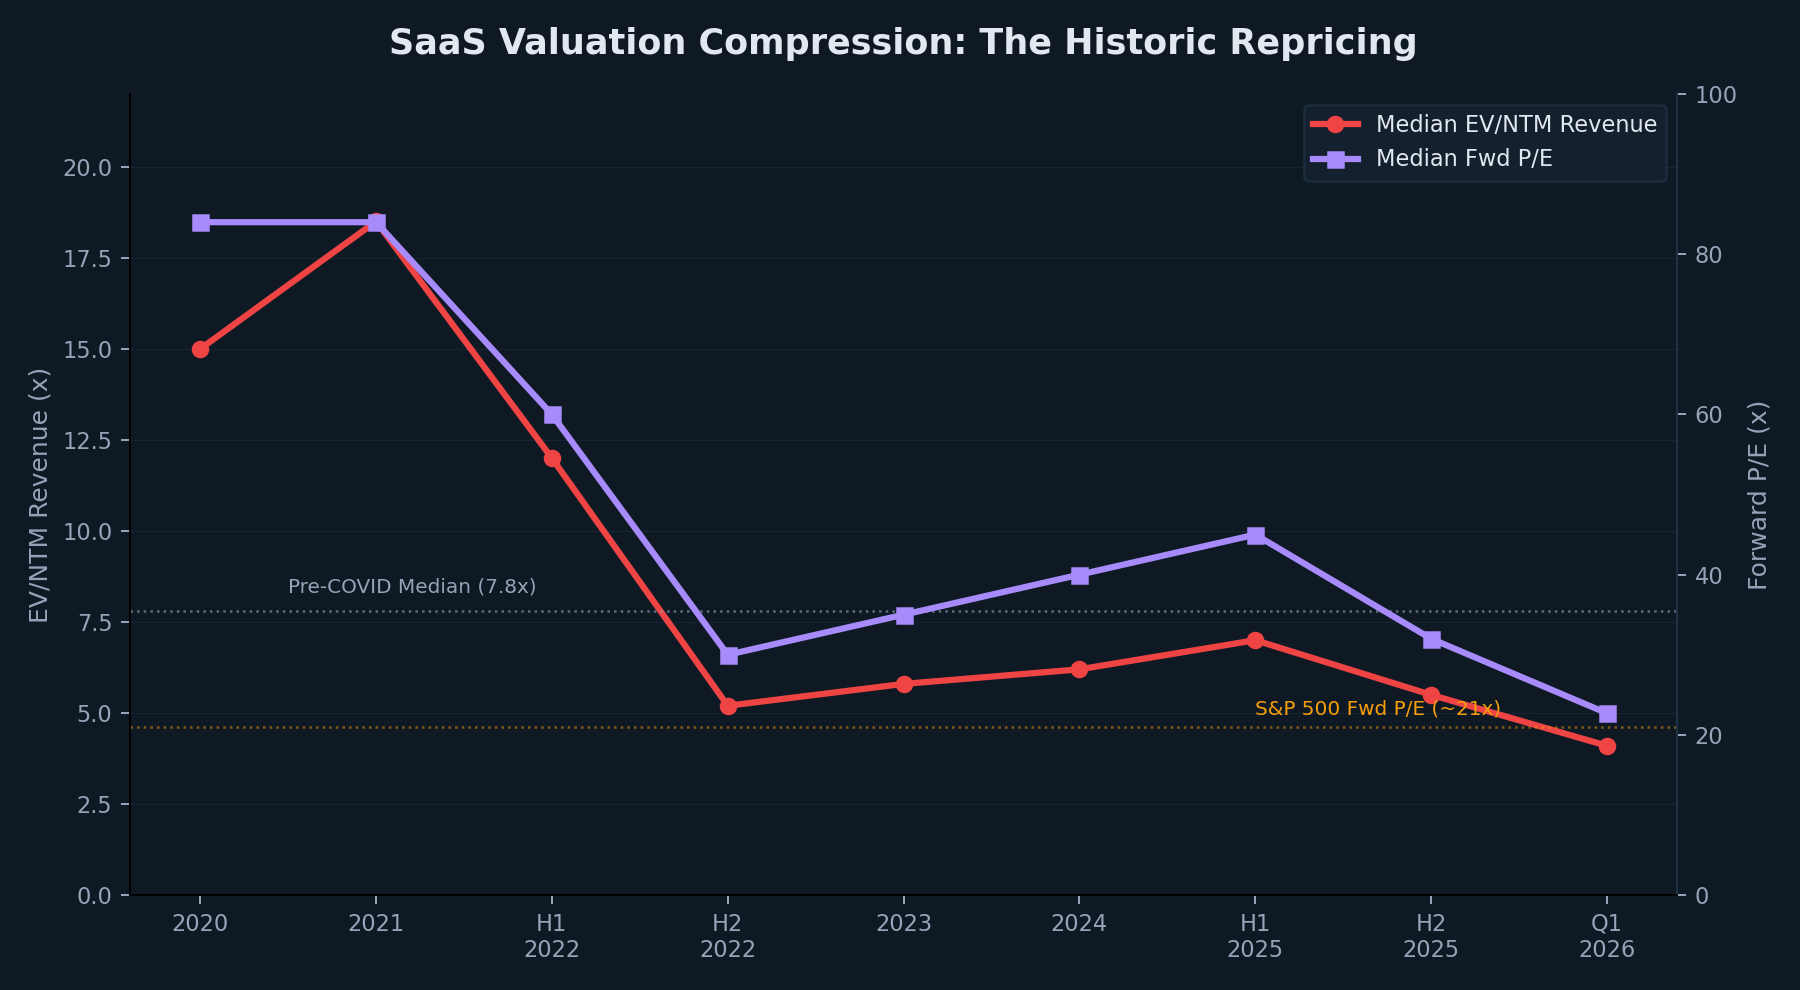
The most striking development in software is the historic compression in valuation multiples. Per Jamin Ball’s Clouded Judgement (January 30, 2026), the median NTM EV/Revenue for cloud software fell to 4.1x, the lowest level in a decade, representing a 47% discount to the pre-COVID long-term median of 7.8x. The median EV/NTM FCF multiple dropped to 18.9x, approximately 30% below its prior 10-year floor of ~26x.
Forward P/E multiples tell a similar story. Per SaaStr, software forward P/E has collapsed from 84.1x during 2020-2022 to 22.7x in Q1 2026, below the S&P 500 for the first time ever. The BVP Nasdaq Emerging Cloud Index (EMCLOUD) stands at ~1,307, down ~20-22% YTD with a total market cap of $1.7 trillion and average revenue growth of 18.6%.
The median Rule of 40 score for public SaaS sits around 21% (12.2% median revenue growth + 9.1% median EBITDA margin per SEG’s 2026 Annual Report), well below the 40% threshold that historically commands premium multiples.
The core driver of this repricing is existential: confidence in the SaaS business model has eroded as AI lowers the marginal cost of software creation, agents threaten to replace human users (undermining per-seat pricing), and foundation model providers build vertically integrated applications.
4.2 Current Sector Trading Multiples
| Subsector | EV/Revenue | EV/EBITDA | Fwd P/E | Notes |
|---|---|---|---|---|
| Hyperscale Cloud | 3-5x | 20-35x | 25-40x | AI capex cycle driving expansion |
| High-Growth SaaS (>20% growth) | 6-12x | 30-60x | 45-80x | Rule-of-40 premium, ARR visibility |
| Mid-Growth SaaS (10-20%) | 3-6x | 15-30x | 25-40x | Margin expansion thesis required |
| Legacy / On-Prem Software | 1-2.5x | 8-15x | 12-20x | Cloud migration discount |
| Cybersecurity | 5-10x | 25-50x | 35-60x | Premium for growth + defensibility |
| AI Infrastructure (Semis) | 8-15x | 20-35x | 25-45x | NVIDIA at ~30x fwd P/E |
| Broad Software Median (Q1 2026) | ~4.1x | ~19x | ~22.7x | 10-year low; below S&P 500 |
4.3 Valuation Premium Drivers
Within software, the primary drivers of multiple differentiation are: (1) revenue growth rate, (2) net revenue retention (NRR), with companies >120% NRR commanding premiums, (3) AI positioning, companies perceived as AI beneficiaries vs. victims, and (4) free cash flow conversion, which has replaced revenue growth as the primary valuation anchor for mid-growth SaaS.
4.4 M&A Transaction Multiples
Software M&A transaction multiples historically run at 4-8x revenue for high-quality SaaS assets and 10-15x for premium growth assets. AI-adjacent acquisitions have reset the ceiling higher (Google/Wiz at ~30x forward revenue). Private equity activity focuses on take-privates at 6-10x EBITDA or 3-5x revenue, with the PE playbook centering on operational efficiency and either re-listing or strategic sale.
5. M&A Activity
5.1 Record $4.9T Global M&A
Global M&A value surged approximately 40% to a record $4.9 trillion in 2025 (PitchBook), surpassing the 2021 high. Technology M&A was up 77% by value (Bain & Company), with 85% of top 2025 tech transactions containing an AI component (PwC). Capital allocation to M&A fell to a 30-year low of 7% of corporate cash as companies directed spending toward AI infrastructure capex instead.
5.2 Key Transactions
| Deal | Value | Multiple | Strategic Rationale |
|---|---|---|---|
| Electronic Arts take-private (PIF/Silver Lake) | $55B | ~15x EBITDA | Largest all-cash sponsor take-private in history |
| Google / Wiz | $32B | ~30x fwd rev | Cloud security platform; 50% of Fortune 100 |
| Palo Alto / CyberArk | $25B | ~25x fwd rev | Identity security consolidation |
| Dayforce / Thoma Bravo | $12.3B | ~6x rev | HCM software take-private |
| ServiceNow / Armis | $7.75B | ~20x fwd rev | OT/IoT cybersecurity platform |
| BlackRock-MGX / Aligned Data Centers | $40B | N/A | AI infrastructure real estate |
5.3 Private Equity in Software
Private equity drove 58% of all SaaS M&A transactions in 2025 (SEG), with total PE deal flow exceeding 9,000 transactions and $1.2 trillion in value (PitchBook). However, S&P Global notes PE firms have dialed back new investments in application software for a third consecutive year amid concerns that AI automation could erode demand. The focus has shifted toward AI infrastructure, data platforms, and cybersecurity.
6. Magnificent Seven & Market Structure
6.1 Combined Metrics
The Magnificent Seven’s combined market capitalization stands at approximately $19.5 trillion as of early April 2026, down from a peak near $21.8 trillion in mid-January. The group represents 32.5% of the S&P 500 (March 31), down from a peak of ~37% in October 2025.
6.2 YTD Performance & Rotation
All seven stocks are in negative territory YTD, with the group collectively returning -10.5% through Q1, compared to -4.6% for the broader S&P 500. The S&P 493 (excluding Mag 7) was up +4% through February while Mag 7 was down -7%, representing the sharpest performance divergence since the index concentration era began.
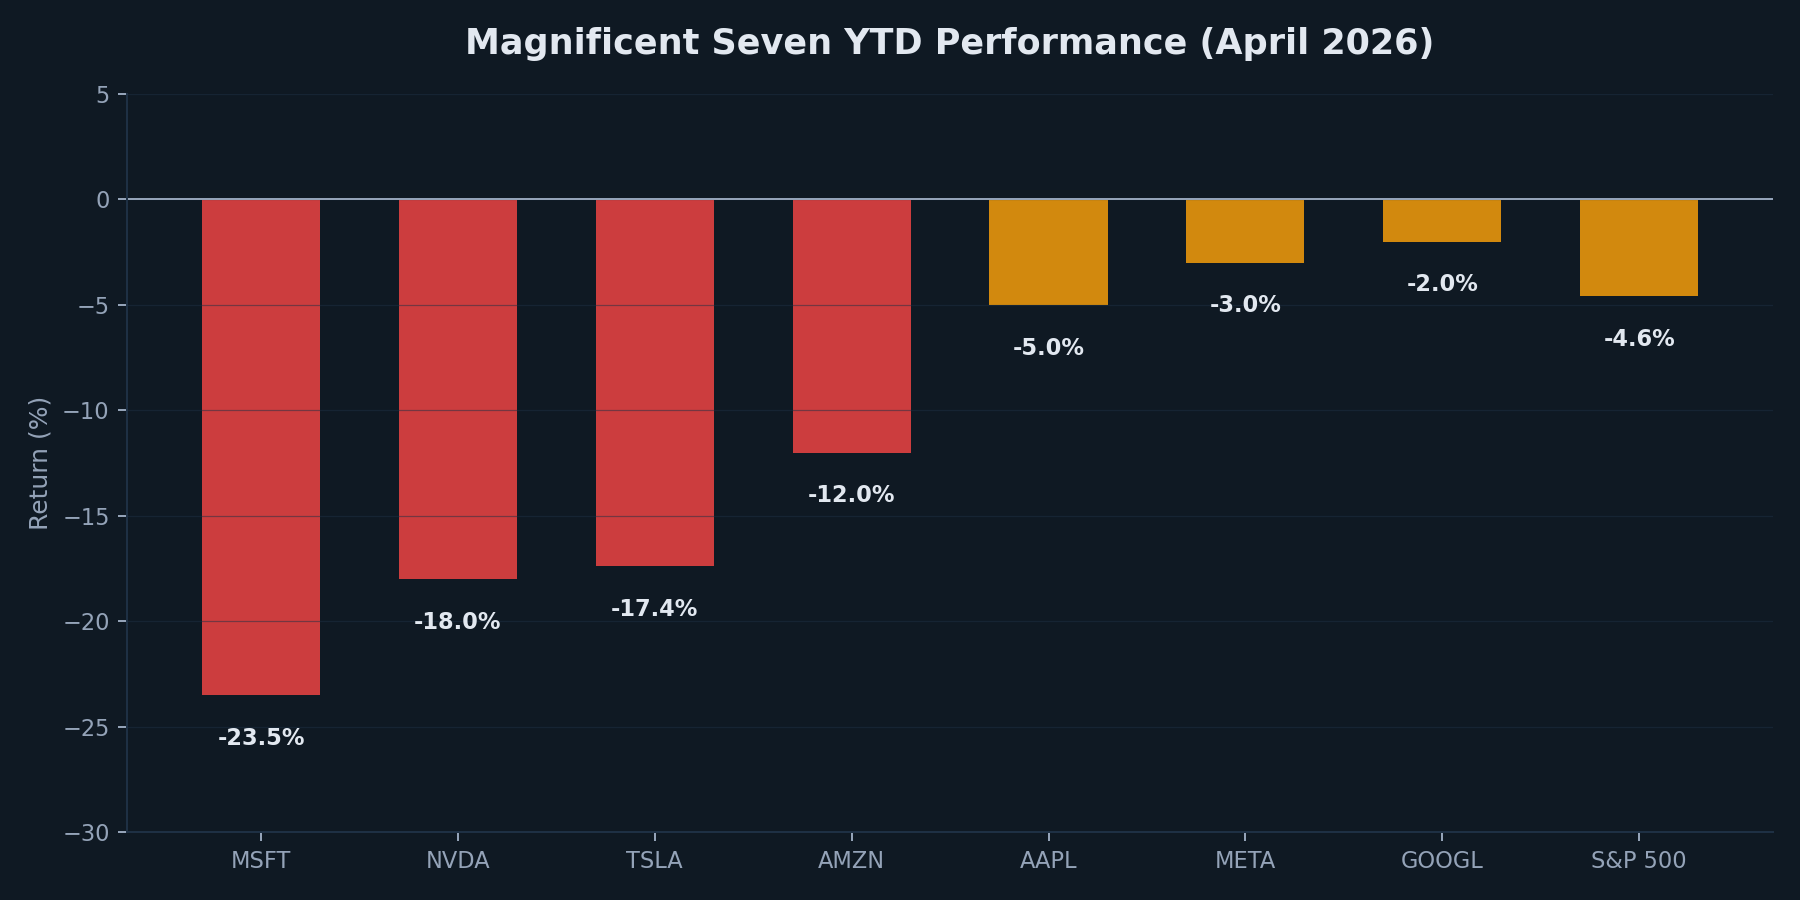
A meaningful rotation is underway: energy surged ~+33% YTD, equal-weight S&P 500 (RSP) declined only -1.2% versus cap-weighted at -4.6%, and Bloomberg noted that the correlation between the Mag 7 index and the equal-weight S&P 500 turned negative on February 23, an unprecedented decoupling.
6.3 Institutional Positioning
Morgan Stanley’s Q4 2025 13F analysis shows large-cap technology ownership at its lowest point relative to the S&P 500 in 17 years, with a sector-wide under-ownership gap of -155 basis points. NVIDIA is the most under-owned individual name at -2.57 percentage points below benchmark. XLK recorded -$1.31 billion in net outflows over the trailing three months. Major allocators including Strategas, Invesco, and Yardeni Research are recommending underweight positions in Mag 7.
6.4 Concentration Risk
Top-10 S&P 500 concentration sits at a record ~40-41% (RBC, State Street), nearly doubling from ~20% in 2015 and far exceeding the dot-com peak of ~27%. The effective number of securities driving the S&P 500 has fallen to approximately 44 names, the lowest in 35 years. NVIDIA alone represents approximately 8% of the S&P 500.
7. Regulatory Landscape
7.1 EU AI Act
The regulation’s most consequential provisions take effect August 2, 2026, including full compliance requirements for high-risk AI systems (biometrics, critical infrastructure, employment, law enforcement), transparency obligations for chatbots and deepfakes, and mandatory AI sandboxes in each member state. Prohibited practices (social scoring, cognitive manipulation) became enforceable February 2, 2025. General-purpose AI model rules took effect August 2, 2025. Penalties reach up to EUR 35 million or 7% of global turnover. European harmonized standards are delayed, potentially pushing effective compliance for high-risk rules to December 2027 under the Commission’s November 2025 “Digital Omnibus” proposal.
7.2 DOJ vs. Google
Judge Amit Mehta’s September 2025 remedies order rejected Chrome divestiture but banned exclusive default search contracts and required data-sharing with qualified competitors under a six-year oversight term. The DOJ and 35 states formally appealed on February 3-4, 2026, arguing behavioral remedies are insufficient and pushing for structural relief. In the separate ad tech case, Judge Brinkema found Google monopolized publisher ad servers (90% share) and ad exchanges (63-71% share); remedies including potential AdX divestiture are pending.
The FTC’s monopolization case against Meta was dismissed in November 2025 (Judge Boasberg ruled TikTok and YouTube defeat the “personal social networking” market definition). The EU imposed first-ever DMA fines: Apple (EUR 500 million) and Meta (EUR 200 million) in April 2025.
7.3 US-China Tech Decoupling
The Supreme Court ruled 6-3 on February 20, 2026 that IEEPA does not authorize presidential tariffs (Learning Resources v. Trump), invalidating $166 billion in collected tariffs and triggering potential refunds of $175 billion. On AI chip exports, after banning even compliant H20 chips in April 2025, the administration ultimately authorized NVIDIA H200 exports to approved Chinese customers in December 2025 with a 25% revenue tax to Commerce. China’s domestic chip industry remains constrained: Huawei Ascend 910C yields sit at only 5-20% versus NVIDIA Blackwell at 60-80%, and SMIC remains stuck at 7nm with a performance gap expected to widen from 6x to 17x by 2027.
8. Investment Implications
8.1 Key Thematic Opportunities
AI Infrastructure & Enablement Layer: NVIDIA ($216B revenue, $78B Q1 guidance), Broadcom ($73B AI backlog), and TSMC (92% of advanced AI chips) are the highest-conviction plays on AI compute demand. Hyperscaler capex of $600B+ in 2026 provides multi-year visibility.
AI Application Layer: Companies owning unique proprietary data (Salesforce CRM data, Bloomberg financial data, Epic healthcare data) can build defensible AI applications. The opportunity is identifying application-layer companies benefiting from AI monetization before multiple expansion.
Cloud Re-acceleration Beneficiaries: Google Cloud’s 48% growth and AWS’s 24% acceleration suggest the AI-driven cloud workload cycle has years to run. Cloud infrastructure companies (Datadog, Snowflake, MongoDB) with AI-adjacent workloads benefit from the rising tide.
Cybersecurity Platform Consolidation: CrowdStrike, Palo Alto Networks, and Zscaler lead in their categories. The $84-96B in 2025 M&A deal value signals continued consolidation. Enterprises reducing vendor count benefits platform leaders.
Vertical SaaS with AI Acceleration: Healthcare, financial services, legal, and construction vertical software represents structural growth with defensible data moats. M&A multiples remain attractive relative to horizontal SaaS.
8.2 Bull vs. Bear Debates
BULL CASE: The SaaS valuation compression to 4.1x EV/Revenue (47% below pre-COVID median) and Mag 7 institutional under-ownership at a 17-year low create a generational re-entry opportunity. GenAI creates new software categories and expands TAM. Cloud migration still in early innings globally. Software margins structurally expand as AI reduces development costs. Cybersecurity is non-discretionary. The $600B+ capex cycle provides multi-year earnings visibility for infrastructure beneficiaries.
BEAR CASE: AI commoditizes software, with foundation models reducing the value of traditional software IP and compressing pricing. The $600B+ AI capex cycle may produce insufficient returns, transforming the buildout from the greatest technology investment into the greatest capital misallocation. Regulatory risk (EU AI Act, DOJ antitrust remedies) creates structural headwinds. Many software companies are “AI-washing” without demonstrable monetization. Macro uncertainty from tariff disruption, geopolitical conflict, and rate expectations could cause enterprise budget cuts.
8.3 Key Risks
Valuation Risk: Despite rationalization from 2021 peaks, technology stocks remain among the highest-valued sectors. The Mag 7 concentration (32.5% of S&P 500) amplifies both upside and downside risk. Any disappointment in AI monetization could trigger further compression.
AI Disruption Risk: Companies whose core value proposition can be replicated by AI-powered alternatives face displacement risk. The SaaS repricing reflects this existential concern. Incumbents with deep customer relationships, proprietary data, and multi-product ecosystems are better protected.
Geopolitical Risk: US-China technology decoupling, semiconductor supply chain concentration in Taiwan, and evolving export controls on advanced chips represent material risks. The IEEPA ruling creates tariff policy uncertainty.
Concentration Risk: NVIDIA at 8% of the S&P 500, Top 10 at 40-41%, and the effective number of securities at 44 names (35-year low) create systemic fragility.
8.4 Catalysts to Watch
Near-Term (Q2 2026):
- Q1 2026 hyperscaler earnings (April-May): cloud revenue growth trajectory, AI-specific revenue disclosure, capex guidance adjustments
- NVIDIA Q1 FY2027 results (May): $78B guidance beat/miss, Blackwell production ramp, China revenue impact
- Microsoft Copilot seat attachment and renewal data; Salesforce Agentforce revenue trajectory
- TSMC Q1 2026 earnings (April 17): AI chip demand signals, 2nm timeline
Mid-Term (H2 2026):
- EU AI Act high-risk compliance deadline (August 2, 2026)
- DOJ vs. Google appeal resolution; ad tech remedies decision
- AI model developments (GPT-6 expectations, Gemini Ultra 2.0, next-gen open-source models)
- Enterprise AI ROI evidence: Copilot conversion rates, agentic AI deployment metrics
Structural:
- AI infrastructure ROI: whether the $600B+ capex cycle generates sufficient returns
- SaaS pricing model evolution: seat-based to consumption/outcome-based transition
- Semiconductor reshoring: Intel foundry progress, TSMC Arizona ramp, CHIPS Act impact
- China AI capability trajectory: Huawei ascend performance gap, domestic foundry progress
Appendix: Sources & Methodology
This report is prepared for informational and research purposes only and does not constitute investment advice. Market data, estimates, and projections reflect information available as of April 7, 2026.
Data Sources
- Market Sizing: Gartner IT Spending Forecast (Feb 2026), Gartner AI Spending Forecast (Jan 2026), IDC Worldwide AI Spending Guide, Grand View Research, Precedence Research, MarketsandMarkets
- Cloud Market: Synergy Research Group (Q4 2025), Omdia Cloud Infrastructure Tracker (Q4 2025)
- Company Financials: SEC filings (10-K, 8-K, 6-K), company earnings releases and transcripts, S&P Global Market Intelligence
- Valuation Multiples: Clouded Judgement (Jamin Ball), BVP Nasdaq Emerging Cloud Index, SEG 2026 Annual SaaS Report, SaaStr, Windsor Drake SaaS Valuation Report, Aventis Advisors, NYU Stern Damodaran Dataset
- M&A Data: PitchBook, Bain & Company M&A Report 2026, PwC TMT M&A Outlook 2026, Cooley Tech M&A Year in Review, Momentum Cyber, SecurityWeek
- Sector Performance: FinanceCharts, Yahoo Finance, MacroMicro, Simply Wall St, ETF Database, SlickCharts
- Institutional Positioning: Morgan Stanley 13F Analysis (Q4 2025), Ainvest, BlackRock 2026 Investment Outlook
- Regulatory: EU Commission AI Act documentation, DOJ press releases, Sidley Austin legal analysis
- Semiconductor: NVIDIA/AMD/Broadcom/TSMC/Intel earnings releases and SEC filings, Counterpoint Research, IO Fund
Charts
All charts in this report were generated from the data sources listed above. Chart images are located in /images/technology-software/ and can be regenerated from the underlying data.
Important Disclosures
All market size figures are estimates from third-party research providers and may differ materially based on methodology and scope definitions. Revenue and financial data for public companies are sourced from public filings and may reflect different fiscal year end dates. Past performance does not guarantee future results. Readers should conduct their own due diligence and consult with a qualified financial adviser before making investment decisions.
This analysis is produced for informational and research purposes only. All data as of April 7, 2026. For further information, visit shaoxiongyuan.github.io.